- Search Energy EXCH
- 6 Results
Attached Image

Attached Image
- camisa replied Feb 1, 2008
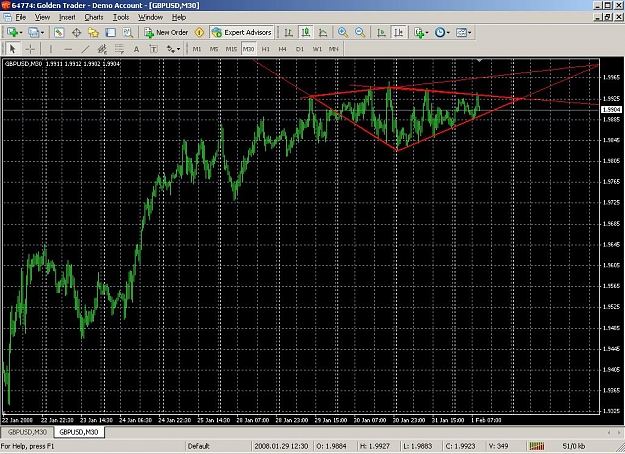
30m chart: triangle/diamond approaching b/o à diamond top formation is a technical analysis reversal pattern that is used to signal the end of an uptrend. This relatively uncommon pattern is found by identifying a period in which the price trend of ...
Cable Update (GBPUSD)
Attached Image (click to enlarge)
Attached Image (click to enlarge)
- camisa replied May 25, 2007
I am not on this thread to learn This thread serves like a kind of chat so people can share their views and just let go the stress of waiting for price to move and exchange some words related to cable trading it's just for fun as people in this ...
Cable Update (GBPUSD)
Attached Image (click to enlarge)
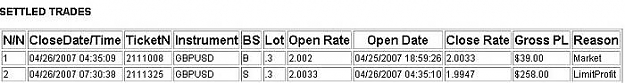
- camisa replied Apr 27, 2007
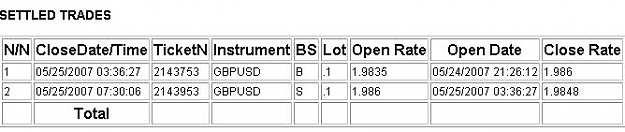
well, yesterday was a good day for me, today was the bad one: I shorted at 9916, it got to 9864 but it reversed and I was stopped out Here are my trades yesterday:
Cable Update (GBPUSD)
Attached Image (click to enlarge)
- Posts by Member Search: 'camisa'