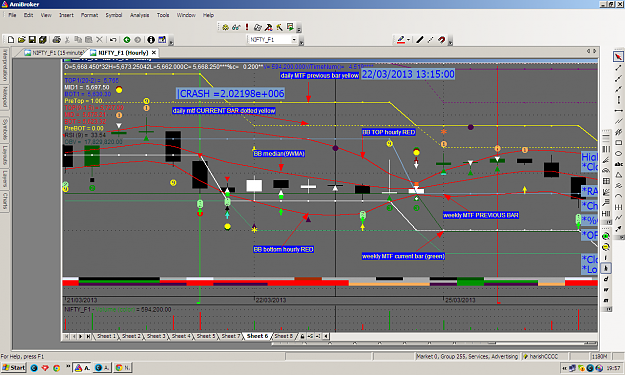
This image has bollinger band of 9WeightedMovingAverage with standard deviation of 1.5 and daily/weekly and monthly multi timeframe lines for this BB.These MTF lines shows position of BB lines of higher time frame on any time frame chart.So if I am ...