- Search Energy EXCH
- 136 Results
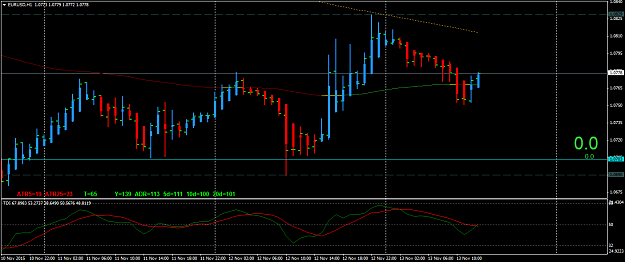
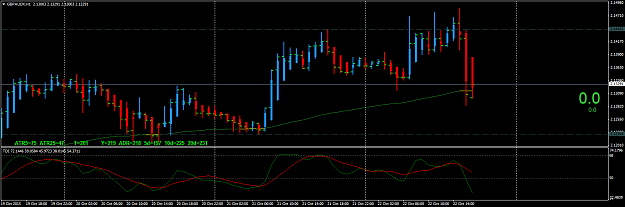
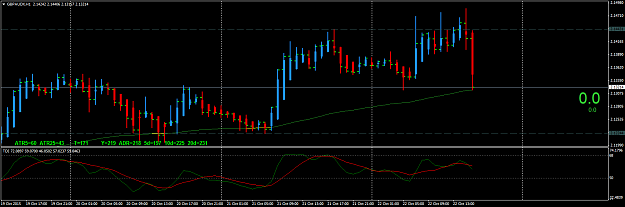
- adikashyap replied Nov 13, 2015
It is better to get out immediately buddy .... or tighten ur SL .... check 1H candles ... BUOB bar and present candle just broke H of P C ... This W C is goin2 close above O ..... My 2 cents ..........
Trading Made Simple
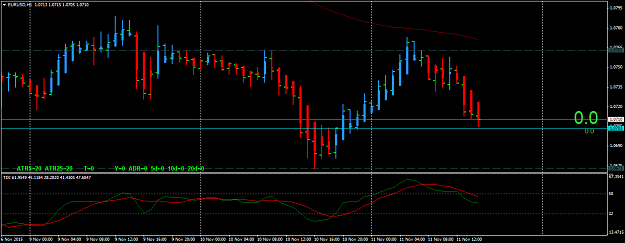
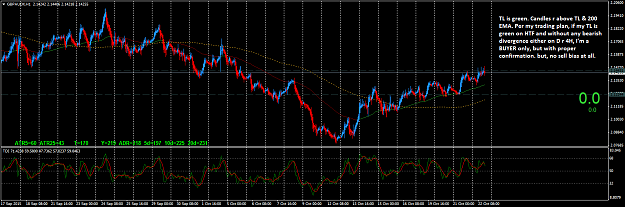
- adikashyap replied Nov 11, 2015
I have walked your path ... understand your thoughts / feeling and the frustration ............. GET RID OF ALL THE UNWANTED INDICATORS ........ LIFE IS AT ITS BEST, WHEN NUDE / NAKED ........... Have naked Chart with simple TDI and a trend line ...
Trading Made Simple
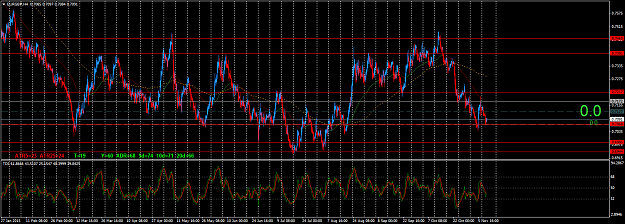
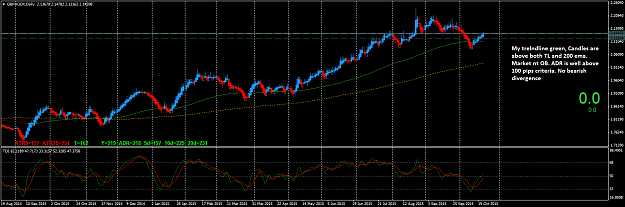
- adikashyap replied Nov 11, 2015
Swing H / L work like R / S ... I normally zoom out to the max on both D and 4H charts and mark those Key Price Levels (KPL's) ... Observe the following EG chart ... 4H zoomed out to the maximum ... Observe my KPL points / levels and also observe ...
Trading Made Simple
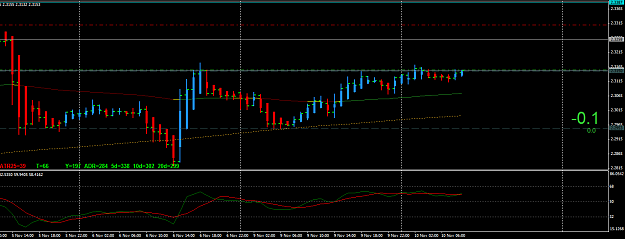
- adikashyap replied Nov 10, 2015
Here is my 1st trade for the day .... GN long .... Reasons ... 1. Last two days, market has been closing higher than open. That way, my bias was bullish. 2. My 89 adaptive EMA is green in both 4H and 1H and market is making bullish rotation on 89 ...
Trading Made Simple
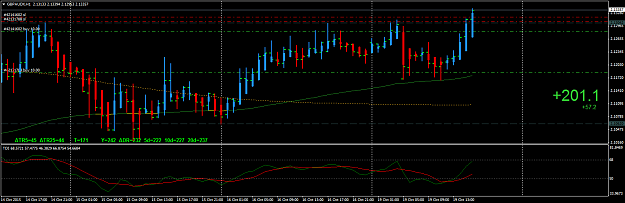
- adikashyap replied Oct 23, 2015
Long on GC ... Reasons ... 1. Candles are above my TL and TL is GREEN on 4H ... 2. Bullish rotation on 1H ... 3. Last 4H candle turned to be a hammer ... 4. Market not OB ... 5. DB and the next candle changed color and closed above Y L ... 6. Market ...
Trading Made Simple
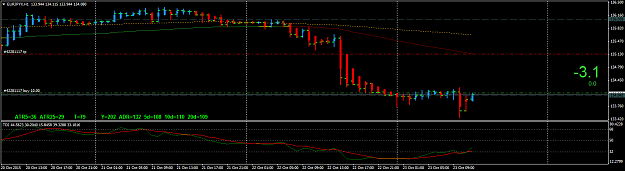
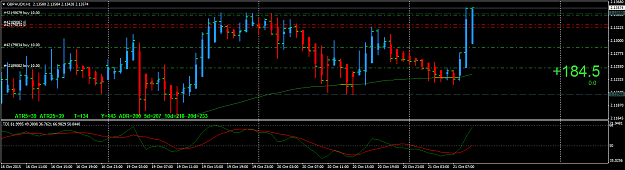
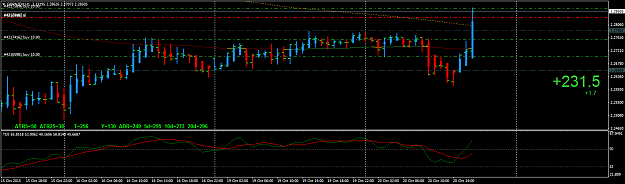
- adikashyap replied Oct 23, 2015
Long on EJ ... 3 reasons .... 1. Market OS on 1H and 4H ... 2. Hammer / PCRF on both 1H and 4H ... 3. Last candle turned blue, broke previous candle H and market coming out of OS ..
Trading Made Simple
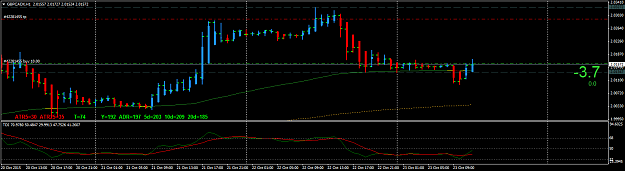
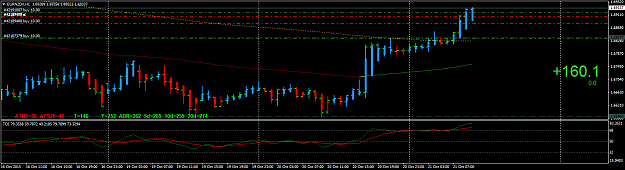
- adikashyap replied Oct 22, 2015
Latest on GA ... I took Long trade on 15M ... 30 Mins ago ... What does 1H candle do? Observe where it closes ... Above my trendline ... Trend Line Rejection ... Why no SL? when I'm observing / following a trade, I won't have any SL ...
Trading Made Simple
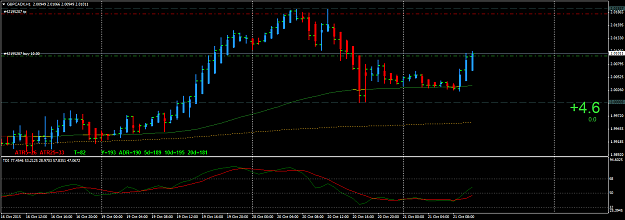
- adikashyap replied Oct 22, 2015
what is the latest? did not want to wait for latest 1H to close ... trying to save 30 Min's ... went to 15M chart ... a bullish Doji 1st ... next 15M closed right on ema 200 ... went long ...
Trading Made Simple
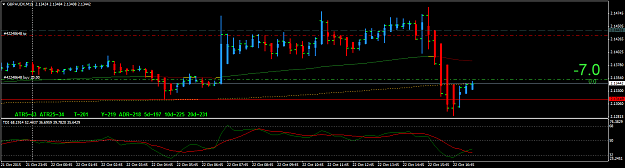
- adikashyap replied Oct 22, 2015
Soooo ... what happened? Price closed just little below my trendline ... which is neither TLR or bearish rotation? So, what do i do? Wait for next candle .... when and if in a doubt ... pass it and wait ...
Trading Made Simple
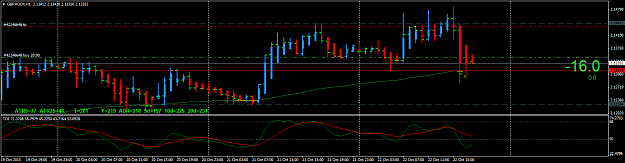
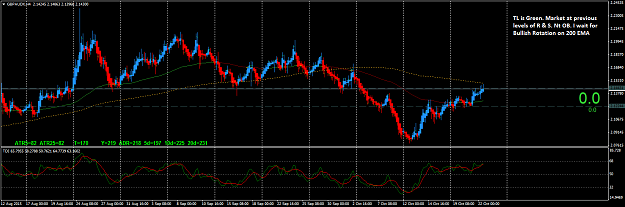
- adikashyap replied Oct 22, 2015
The present 1H candle has 28 Min's to close ... If Price closes above my Trend Line ... That is Trend Line Rejection (TLR) ... If TLR happens, I will go Long ... WHY? There is 110+ pips to Y H ... and I aim to catch 60% of it .... Again a Trading ...
Trading Made Simple
- adikashyap replied Oct 22, 2015
Had been travelling and could not reply earlier. Sorry for that ... Observe the charts and explanations ... Feel free to ask any doubts ... we are all here to learn and prosper together ...
Trading Made Simple
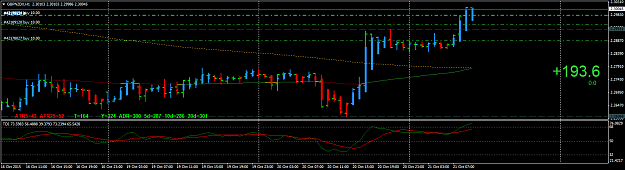
- adikashyap replied Oct 21, 2015
3 full lots on EN, GN and GA ... Big E was right .... keep it simple and its raining pips ......
Trading Made Simple
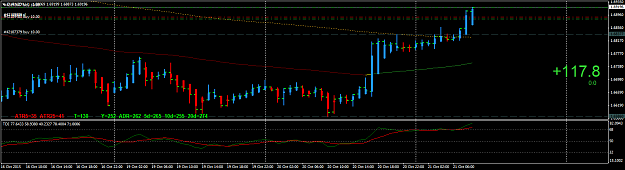
- adikashyap replied Oct 21, 2015
3 full lots on both EN and GN ... love the Greenery so very much ...
Trading Made Simple
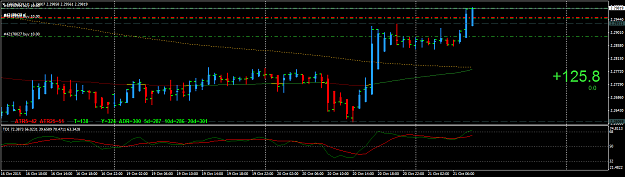
- adikashyap replied Oct 20, 2015
Took the 1st trade when LO candle close above the Open price. Added 2nd position as the last 4H candle turned out to be a Hammer / PCRF candle ...
Trading Made Simple
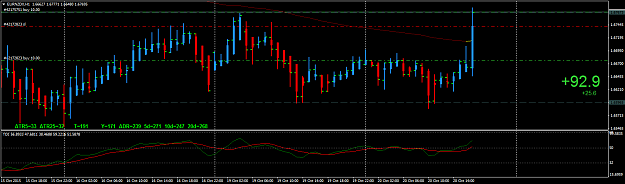
- adikashyap replied Oct 19, 2015
No Monday Blues here ... 2 standard lots running on both pairs ........
Trading Made Simple
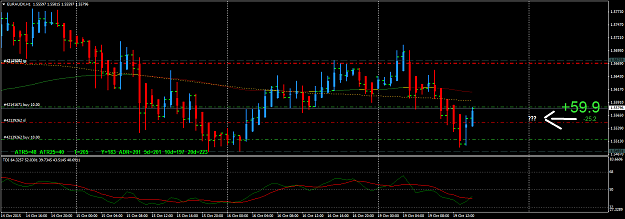
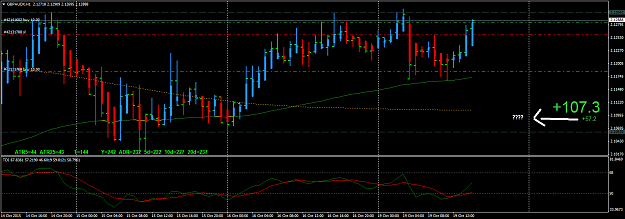
- adikashyap replied Oct 19, 2015
SOS ... My MT4 had some problem ... Un installed and Re Installed it ... Now, te Pipsometer is mis behaving ... Plz observe the arrow marks ... did not have them earlier ... What do they mean? How to get rid of them?
Trading Made Simple
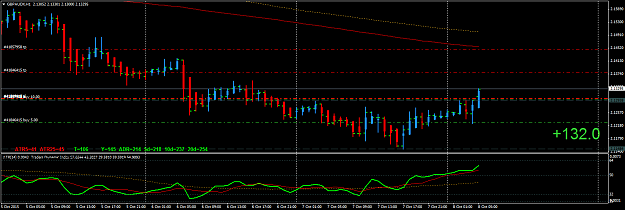
- adikashyap replied Oct 7, 2015
Perfect beginning for a new day ....... 1 pos carried from last night ... Added a new pos, when the last 1H candle broke n close above NSH ..........
Trading Made Simple