- Search Energy EXCH
- 15 Results
- Yarek replied Aug 21, 2023
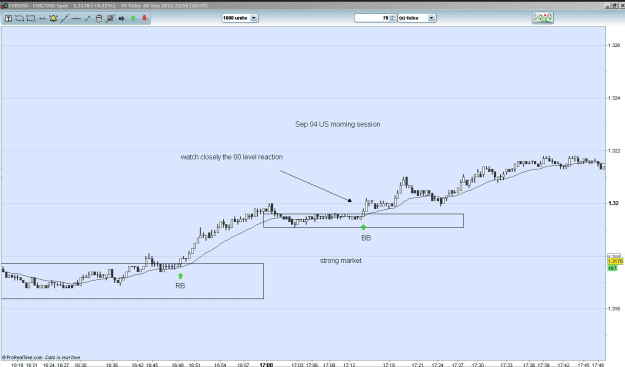
It coincided I had this chart open. This is one of Volman's charts. You can see that price traveled about 25 pips after it broke out at the RB. It had very small pullbacks and little sideways action. As in Kumuntu's chart, price got rejected from ...
Volman Style (70-tick chart)
- Yarek replied Aug 21, 2023
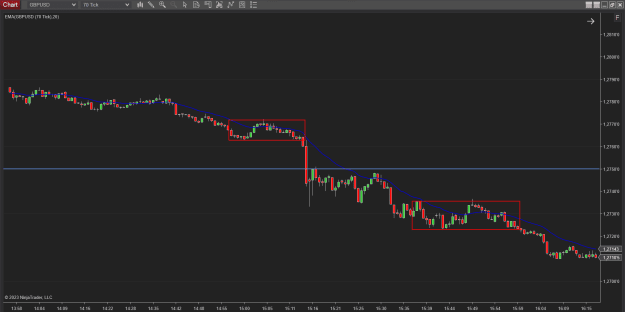
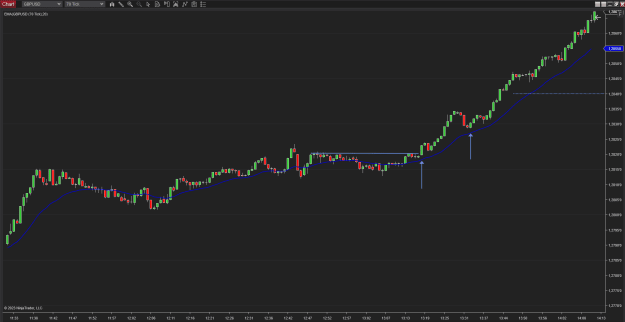
Good morning. Beginning of the week does not seem to be favorable for the GBP/USD. Market is very slow, therefor I didn't sit by my screen the whole time. Edit: (2hours later) price went flat on European lunch hours. European and US overlap might ...
Volman Style (70-tick chart)
- Yarek replied Aug 18, 2023
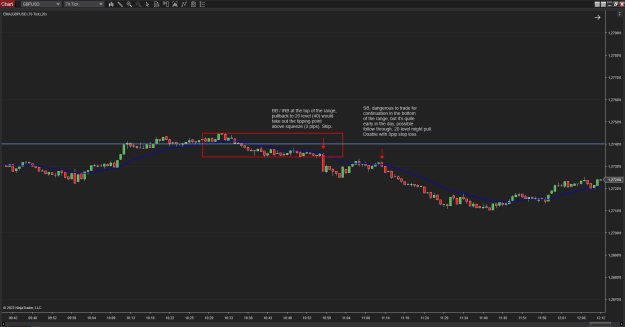
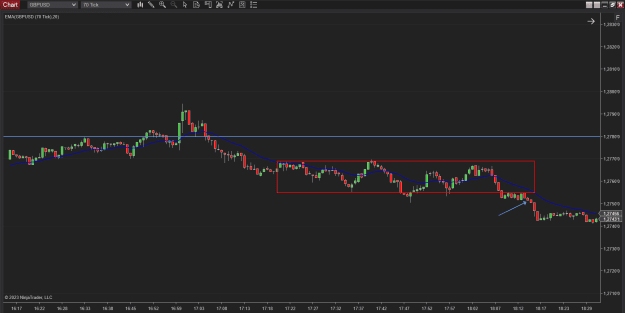
Setup speaks for itself. This Fb's is uncommonly good looking. It is precisely 50% retracement of earlier move.
Volman Style (70-tick chart)
- Yarek replied Aug 18, 2023
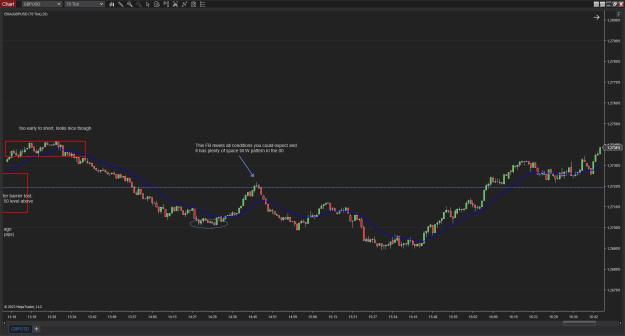
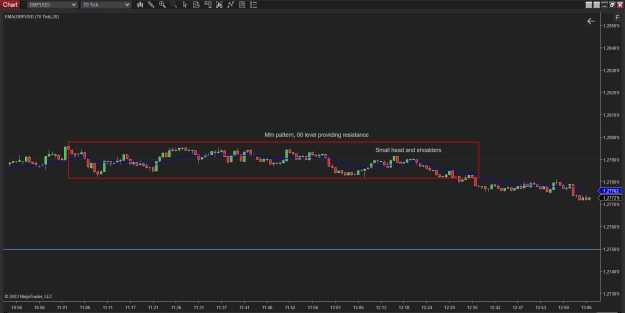
Only managed to find one today, was a little short in time. The fact that this range took 3 and a half hours to form also comes into play. I still prefer today's price action over yesterdays. Better to get one good opportunity you're confident about ...
Volman Style (70-tick chart)
- Yarek replied Aug 17, 2023
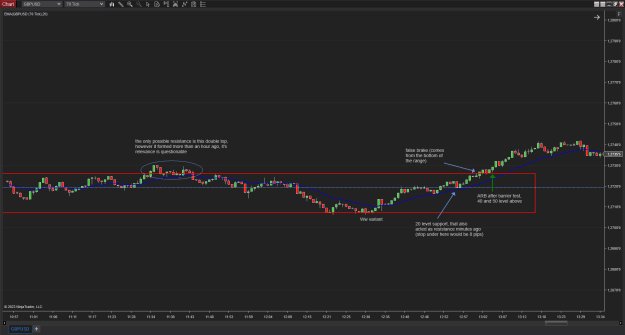
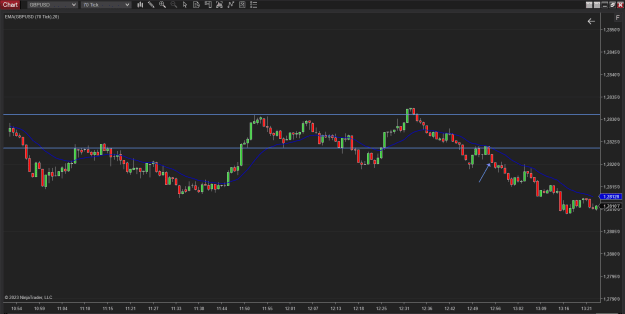
Good afternoon (for europeans). Decided to take a day to analyze market real time today. (Actually it wasn't full day, since starvation hasn't been proven to increase profits). GBP/USD behaved in a way that's not quite usual. (A mere 10-15 pip ...
Volman Style (70-tick chart)
- Yarek replied Aug 2, 2023
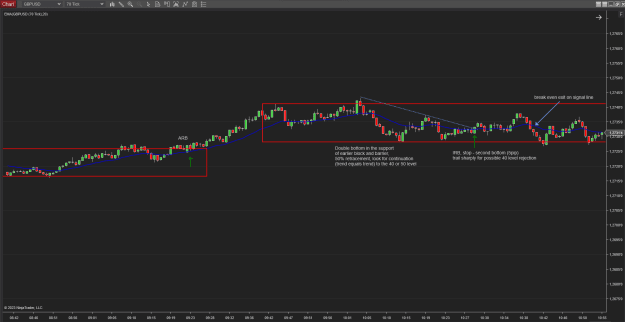
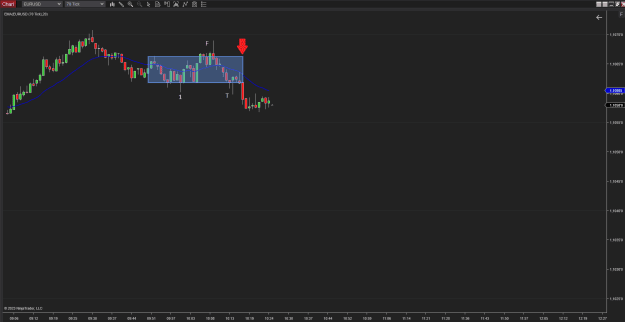
First arrow RB would definitely be skipped by most traders, 5 bars later there was a retest of 00 (signal line). With no support below and considering heavy downtrend aggressive scalper might have taken this ARB. There was also a M pattern (double ...
Volman Style (70-tick chart)
- Yarek replied Aug 2, 2023
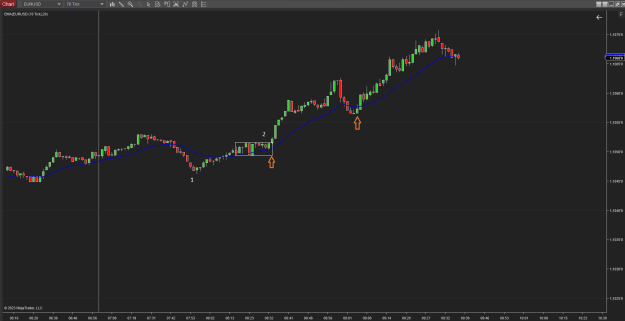
Found 2 good looking BB's. Neither of them had the perfect squeeze between MA and signal line, but its okay in a fast trend. First one was also a RB. Take profit could have been increased to 50 round number (12 pip). Second was quite big for a ...
Volman Style (70-tick chart)
- Yarek replied Aug 2, 2023
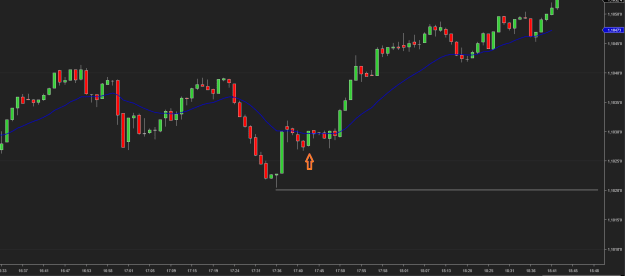
Simple RB. 10 pip take profit reached. Waiting for 80 level to get penetrated would still result in 10pip profit.
Volman Style (70-tick chart)
- Yarek replied Aug 2, 2023
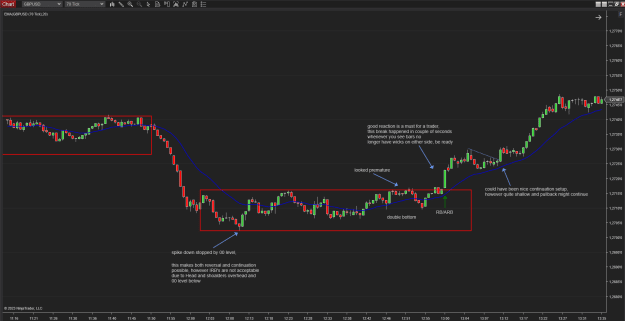
After looking at yesterdays chart I managed to find an ARB. First penetration of bottom barrier was a false break, as it followed the top barrier bounce. Second penetration was a tease, which lacked buildup. If you had entered without waiting for 50 ...
Volman Style (70-tick chart)
- Yarek replied Aug 1, 2023
Its nice to see you upload your trades ! Regarding the EMA, I remember Volman's advise to not put too much importance on it. And I don't think that changing the length will have an impact on your profitability, unless we talk about algorithmic ...
Volman Style (70-tick chart)
- Yarek replied Jul 28, 2023
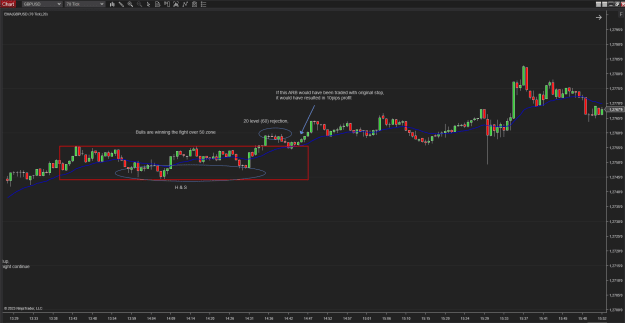
As I was running my eyes through the chart I found this. 1 - BB, MA is pointing upwards, we can see a weak uptrend which makes breakout to the upside more likely. Also there was a fake breakout to the downside. Resistance line is also a 20 zone, ...
Volman Style (70-tick chart)
- Yarek replied Jul 26, 2023
This RB is quite complicated in my opinion. There were a lot of traps considering the size of trading range. 1 is not even a valid entry - setup hadn't developed at that point as upper signal line was only tested once. It was also a test of 20 round ...
Volman Style (70-tick chart)
- Yarek replied Jul 26, 2023
Whenever there's a trend, setups usually develop quicker. Every trader must be exited on trend days (you might get a with the trend setup in 10 minutes period compared to having to stare at the monitor for 2 hours sometimes to get a breakout setup ...
Volman Style (70-tick chart)
- Yarek replied Jul 25, 2023
FB (could be traded as a BB, since there are many equal tops, but FB would be first one to appear had I been live trading). One might say its a countertrend setup therefor not reliable. In my opinion the lower low prior to setup wasn't important, as ...
Volman Style (70-tick chart)
- Yarek replied Jul 25, 2023
Thats the first one I noticed, probably because it is quite obvious. Its debatable whether it is a ARB or BB. (BO - breakout, DB - double bottom, DT - double top). I use an old version of Ninjatrader 8 for charting with FXCM demo. Mainly because the ...
Volman Style (70-tick chart)
- Posts by Member Search: 'Yarek'