- Search Energy EXCH
- 45 Results
-
 Wolves77 replied Nov 24, 2016
WOW, wasn't expecting that, excellent video Mr. Pip. very good delivery, calm, measured, thoughtful as always. 46 minutes just flew by. It goes without saying that i really appreciate your time on this and i hate being a giant pain the ass, but i ...
Ratios & Harmonics: a Different Way to Trade
- Wolves77 replied Nov 22, 2016
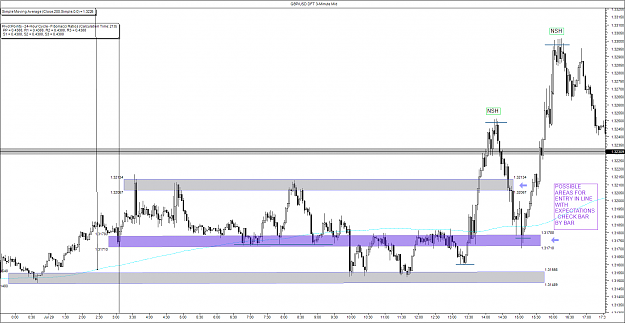
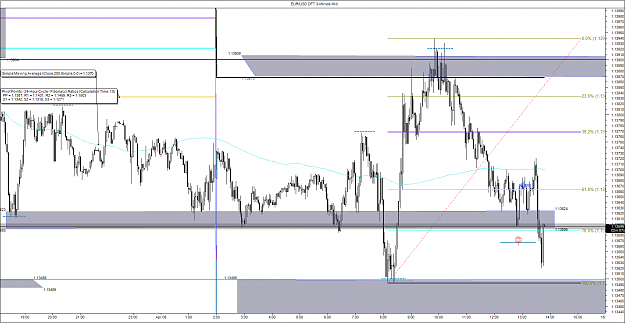
hey mr. pip, struggled to find anything to trade today, whenever i go through a tough period i tend to tighten up the rules and try to follow a clear line of logic, but if i do this i never end up taking a trade. Can you see any opportunities here ...
Ratios & Harmonics: a Different Way to Trade
- Wolves77 replied Nov 22, 2016
i think the M5 chart just shows more data, so at first glance they can seem different. I've always used m3 and the differences have always seemed slight, although i agree those subtle differences can make a big difference when deciding on whether to ...
Ratios & Harmonics: a Different Way to Trade
- Wolves77 replied Nov 22, 2016
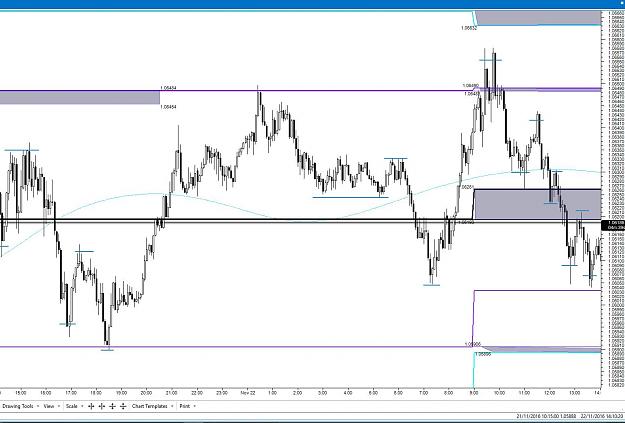
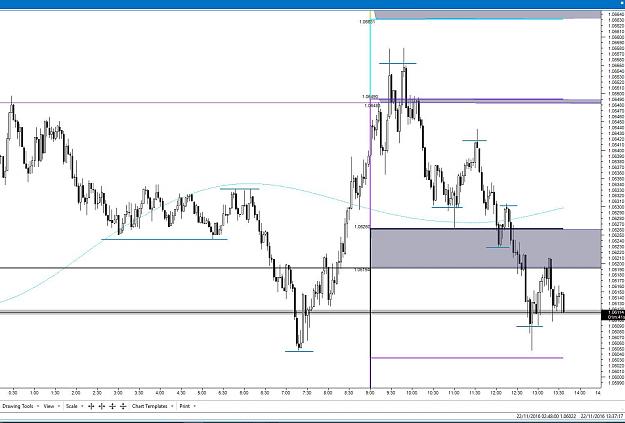
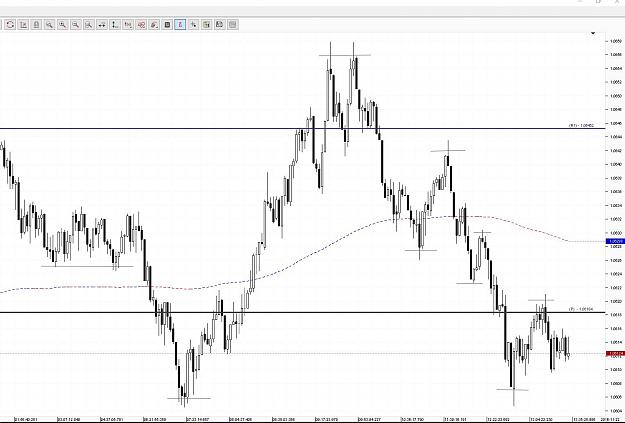
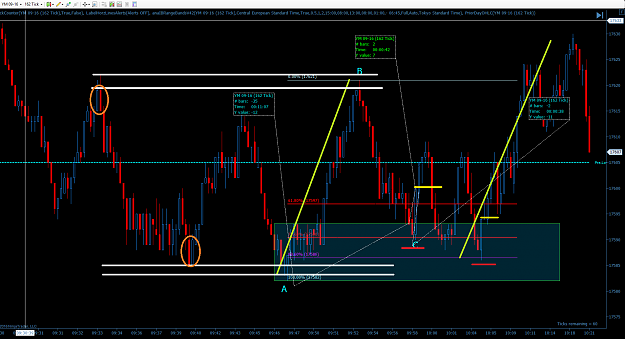
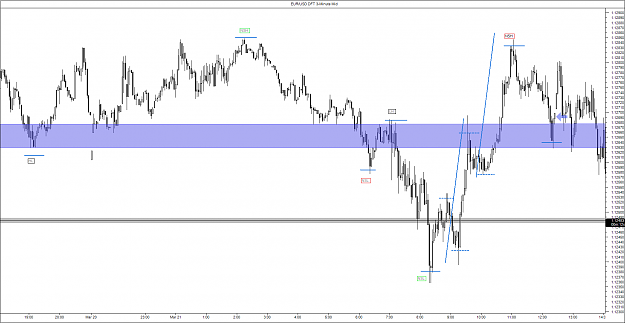
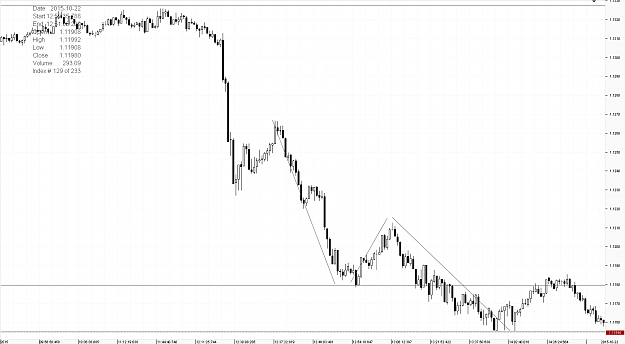
bit random this, but anyone wondering about the difference between time and tick based charts, heres the current pa on E/U 3min chart and 233 tick chart. overnight action was condensed on the tick chart as expected but since the open they are almost ...
Ratios & Harmonics: a Different Way to Trade
- Wolves77 replied Nov 19, 2016
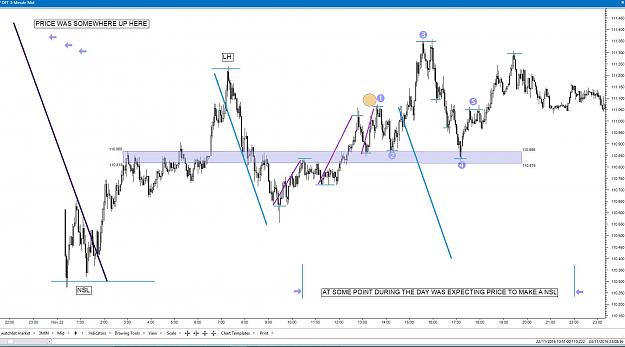
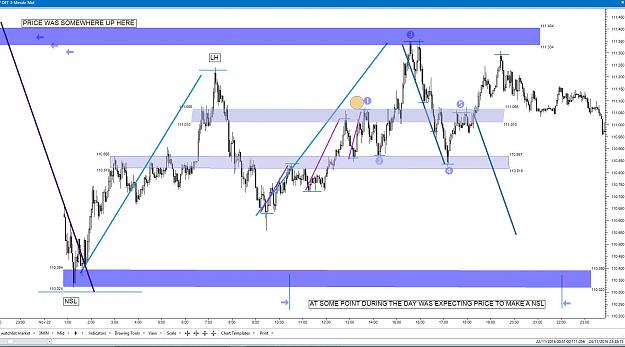
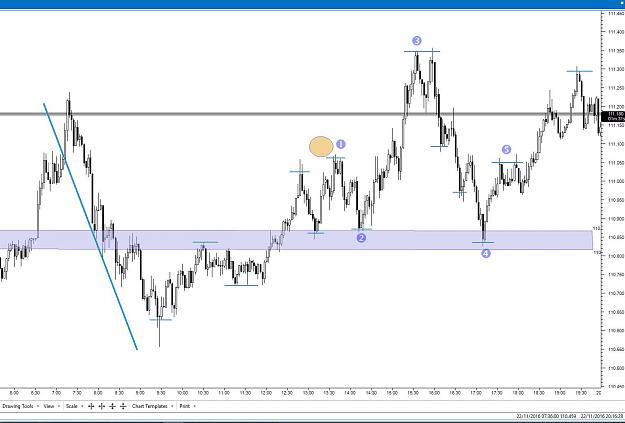
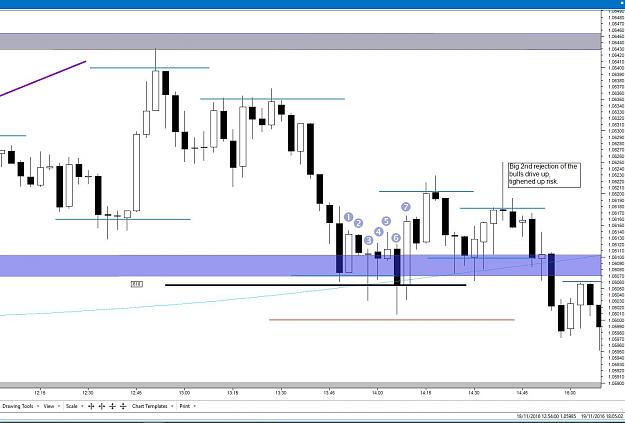
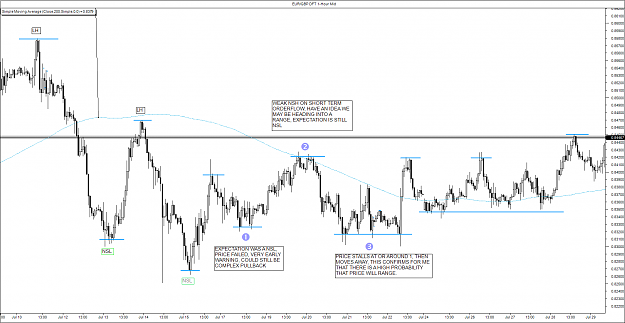
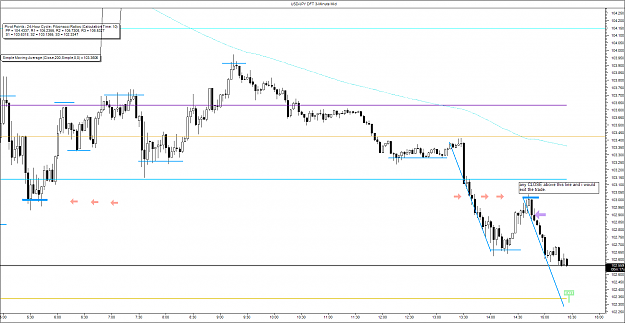
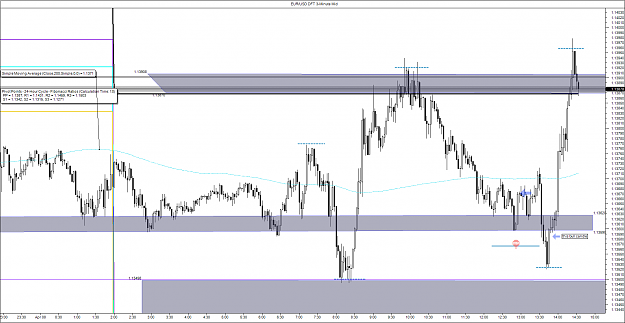
Hey Mr. pip, was just looking at the chart you did for sakeplz on the E/U, i took a long trade in that area where you were advising a short. just wondering if you could look at the trade and see if there's something im missing. price had been stuck ...
Ratios & Harmonics: a Different Way to Trade
- Wolves77 replied Jul 30, 2016
yeah, even tho i'm really tight on entries, the irony is once a trade starts to move in my favour i give it all the room in the world, i rarely move to break even too quickly, because price has a tendency to come back and use my entry line as a ...
Ratios & Harmonics: a Different Way to Trade

- Wolves77 replied Jul 29, 2016
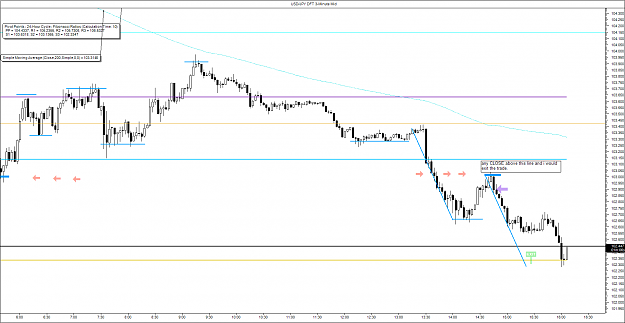
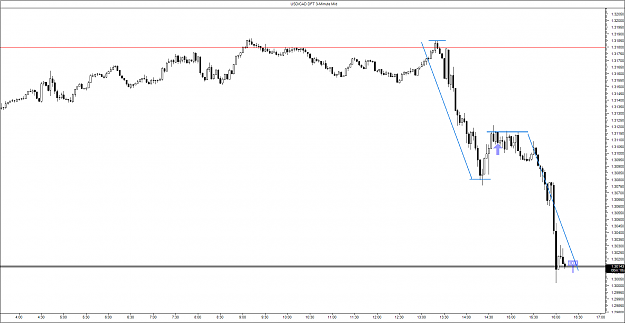
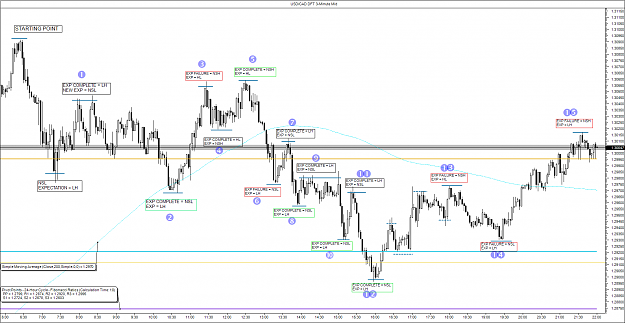
yup it hit image and so did usd/cad. My general trading right now is so basic i won't bother marking the chart below, i reckon most folks will see where i would have entered short when i would have exited the trade manually and where i was looking ...
Ratios & Harmonics: a Different Way to Trade
- Wolves77 replied Jul 29, 2016
aaahhhh, i was posting on the thread and i missed this trade lol, never mind this months been a write off anyway, altho if this trade hits target (55 pips) it would have wiped out all the losses from the last 2 weeks. i take a lot of losses but they ...
Ratios & Harmonics: a Different Way to Trade
- Wolves77 replied Jul 29, 2016
Cheers for the info jmezz, will try to post more on the site, the only problem i have is time is a problem. when i do get to trade, i'm on 3 min charts eur/usd and usd/jpy, sometimes usd/cad, so its a lot to keep an eye on. i also close out trades ...
Ratios & Harmonics: a Different Way to Trade
- Wolves77 replied Jun 25, 2016
Hi Jmezz, yeah, i see what your saying now, and if your fed up with being stopped out and then price going in your original direction then i know that one all too well. ultimately i think the best way to trade is whichever way we feel makes the most ...
Ratios & Harmonics: a Different Way to Trade
- Wolves77 replied Jun 25, 2016
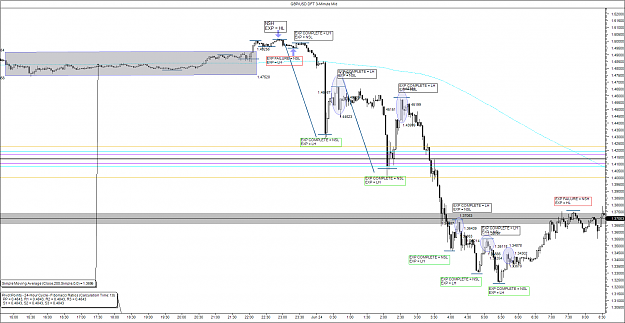
Hi Ujku, never noticed that price sometimes retraces deep after the initial 1:1 after a break of the range. A quick look at my charts and it does seem to happen a lot. The chart below is the madness that was brexit and it even happened there. ...
Ratios & Harmonics: a Different Way to Trade
- Wolves77 replied Jun 24, 2016
Hi Jmezz, It depends on how you count each NSH, NSL, HL or LH, to reach the percentage total. Didn't want to mention this at the beginning of the year while mr. pip was doing his training and the last thing i want is to criticize damian after all ...
Ratios & Harmonics: a Different Way to Trade
- Wolves77 replied Apr 8, 2016
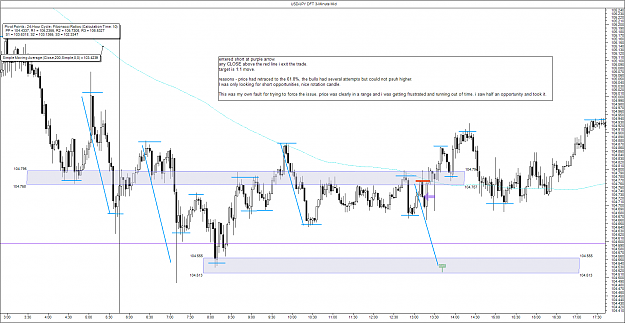
yeah i see what you mean, the strong bull candle in hindsight looked a good entry and ultimately the expectation was a nsh, but price had broke the 78.6, the bears were showing strength and accelerating and price had broken previous support. in ...
Ratios & Harmonics: a Different Way to Trade
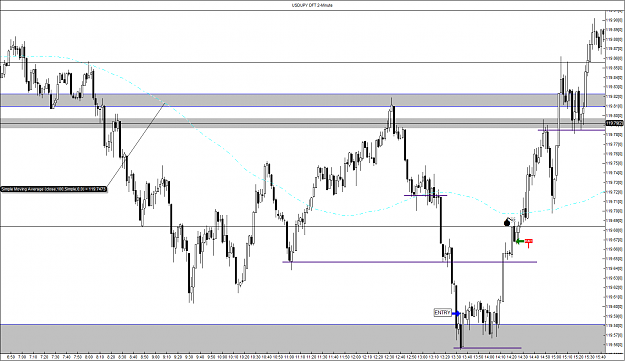
- Wolves77 replied Apr 8, 2016
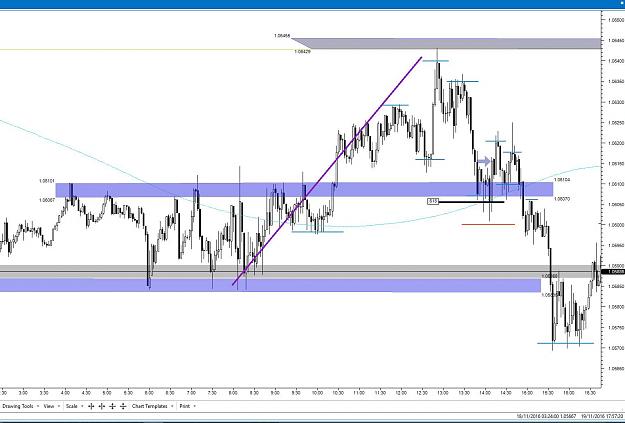
went long at blue arrow short term order flow was bullish (dotted lines) long term expectation (slightly off screen) was a NSH, the bears were decreasing in momentum, and price was holding in the golden zone, which was also an area of structure. ah ...
Ratios & Harmonics: a Different Way to Trade
- Wolves77 replied Mar 21, 2016
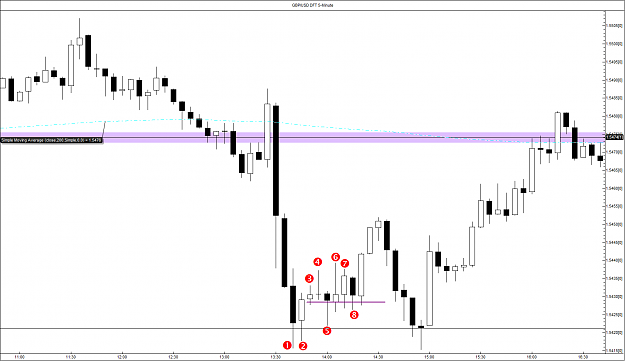
afternoon traders, been a while since i posted, but got some time to trade today, here's my first trade. ended up -8 pips reasons for entry, expectation was a nsh was looking for price to pull back to a mid to deep retracement, price pulled back ...
Ratios & Harmonics: a Different Way to Trade
- Wolves77 replied Oct 22, 2015
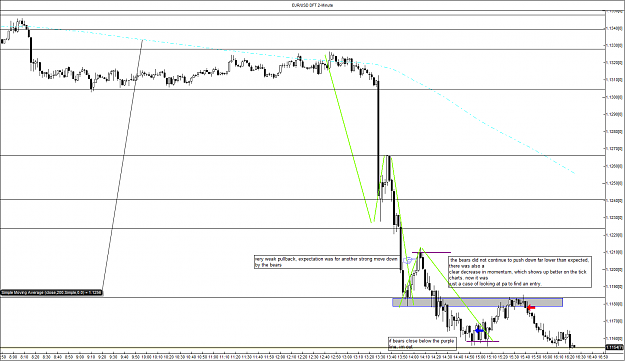
The tick charts helped me out a bit today, got a bit lucky tho aswell, 2 trades for +10 and +16. Just my 2 cents, but i'm not keen on the pa on tick charts, altho the overall flow of the charts seems much clearer. took the long trade below ...
Ratios & Harmonics: a Different Way to Trade
- Wolves77 replied Oct 22, 2015
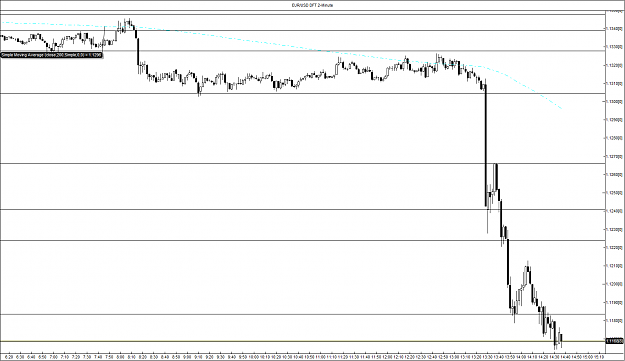
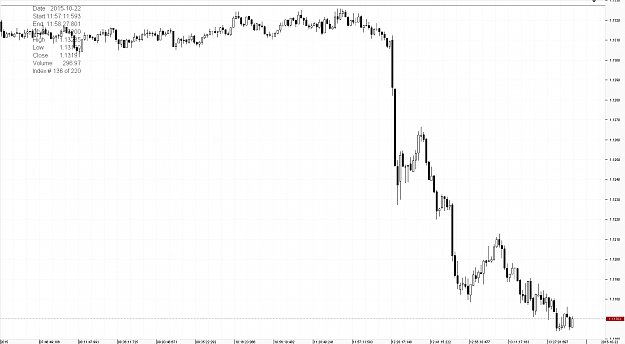
Hey mack, heres the difference between a 2 min chart and a 144 tick chart. image image If you want to check out ticks for a few weeks, have you tried Dukascopy, i think any non us resident can join, i keep trying the 2 week free trial while i ...
Ratios & Harmonics: a Different Way to Trade
- Wolves77 replied Oct 15, 2015
hey mack, i would have been looking to go short in exactly the same area as your first trade based on expectations but ultimately wouldn't have entered due to the price action, the second trade i would have been identical but would have waited for ...
Ratios & Harmonics: a Different Way to Trade
- Wolves77 replied Oct 13, 2015
yep, have to agree, i can't let a trade a run to save my life.
Ratios & Harmonics: a Different Way to Trade been trying to follow honest's example and let trades run, (thats why i love this thread, different perspectives and great info). its my one big weak area and i'm pretty sure it's ...
- Wolves77 replied Sep 29, 2015
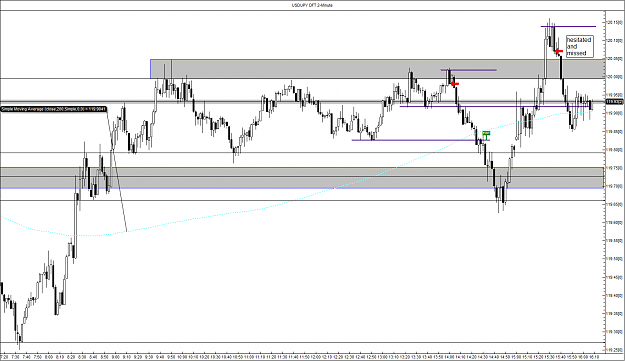
Good luck on playing that breakout Mack, i just missed mine because i chickened out at the last minute
Ratios & Harmonics: a Different Way to Trade As much as i like trading on a 2 minute chart, the problem is if i hesitate for just a few seconds at the close of the candle i dont click to ...