- Search Energy EXCH
- 30 Results (1 Threads, 29 Replies)
- Udkox replied Nov 23, 2021
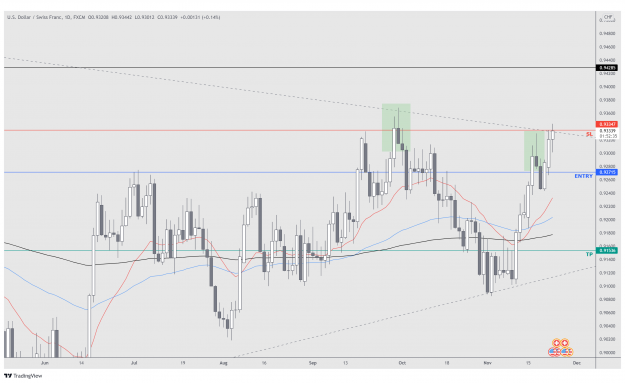
I want to share my failed trade and some thoughts. My take before the trade A triangle has formed. Because the market is moving sideways, it could be a good trade if the PA is good. I see a Shooting Start in the Daily (worker) so I set the Entry ...
Strat's PASR Long Term, Stress Free Trading
- Udkox replied Oct 12, 2020
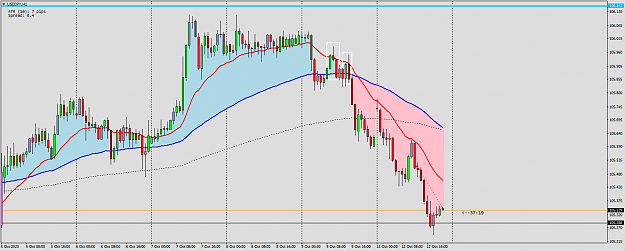
My latest trade. There were so many 5M trades available, but I didn't have the time to monitor it, so I traded the 1H instead. I highlighted what I think were good entries in a white box. Please comment my entries, exit and levels. Cheers!
Strat's PASR Long Term, Stress Free Trading
- Udkox replied Oct 8, 2020
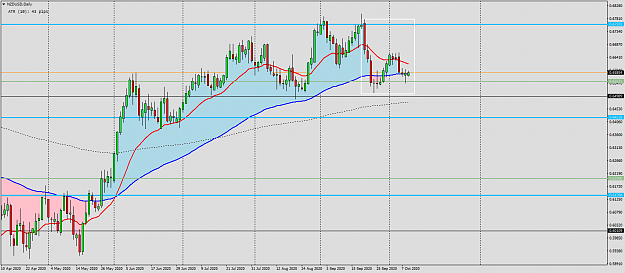
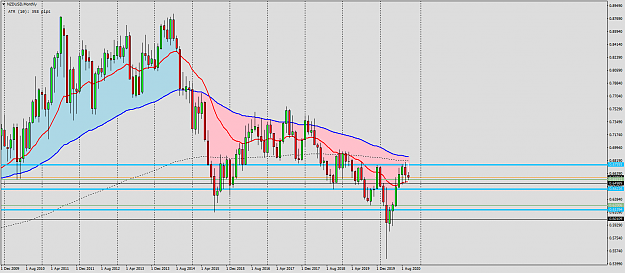
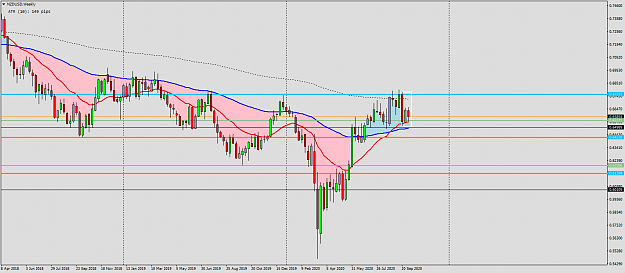
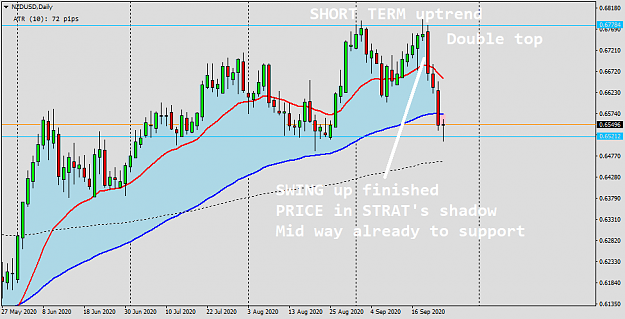
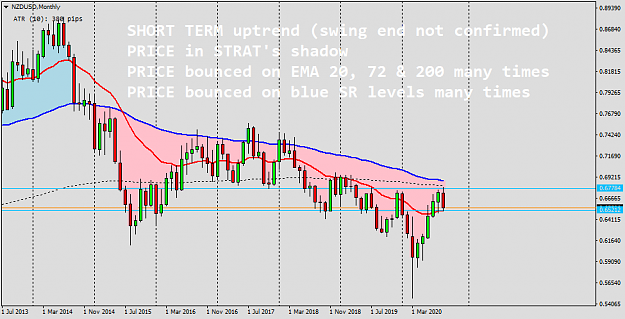
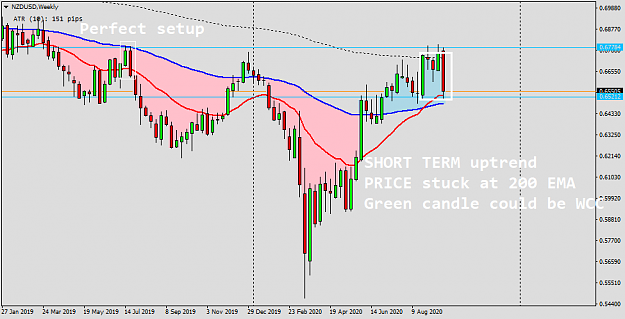
Here I come with another post! Let's see if someone comments on this one! Be skeptical of my levels. NZD USD: currently directionless, a setup might show up if PRICE drops. Big boss: On a nice DOWNTREND for years, but on a SWING UPWARDS right now. ...
Strat's PASR Long Term, Stress Free Trading
- Udkox replied Oct 7, 2020
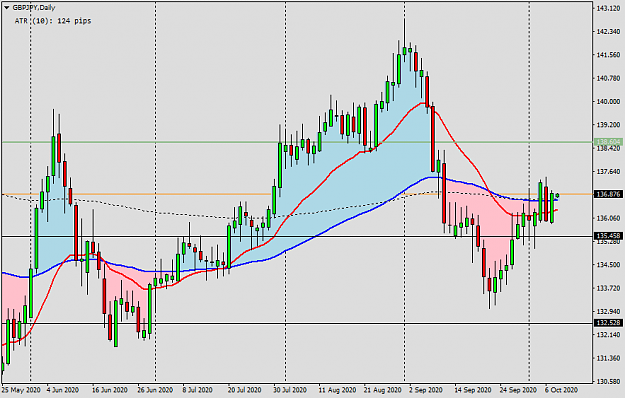
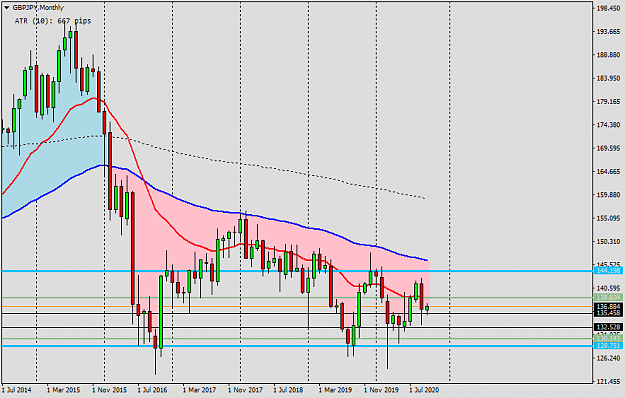
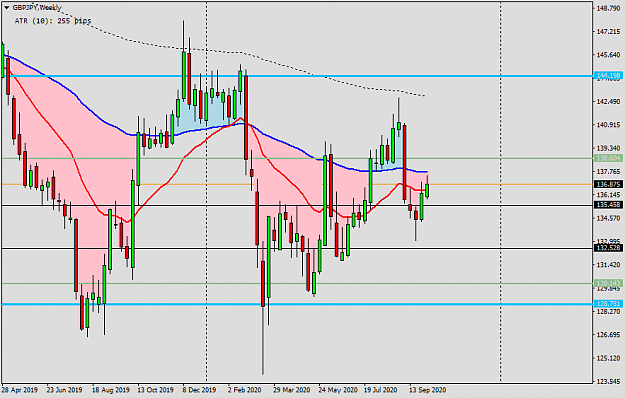
This looks quiet, so here I come! Hopefully my commets will trigger some of you! Currently looking at GBP JPY, my levels might be wrong. Big Boss: Making LOWER HIGHS since May 2015. Nice steady slope DOWNWARDS, respecting Strat's shadow. BEARISH ...
Strat's PASR Long Term, Stress Free Trading
- Udkox replied Oct 3, 2020
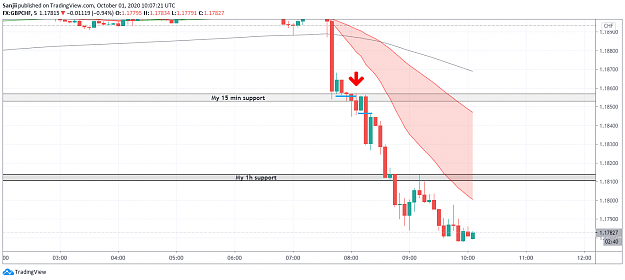
Of course, maybe I am not understanding when you entered. I am assuming you entered after the close of the candle you indicated. In that case, I was trying to understand the idea behind your trade. HAMMERS are PRICE REVERSAL patterns, and you ...
Strat's PASR Long Term, Stress Free Trading
- Udkox replied Oct 2, 2020
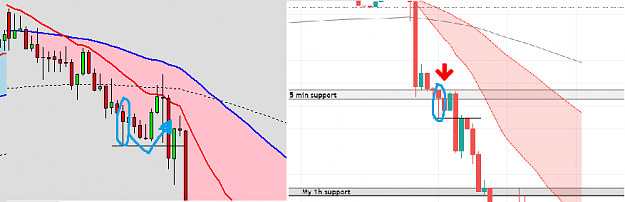
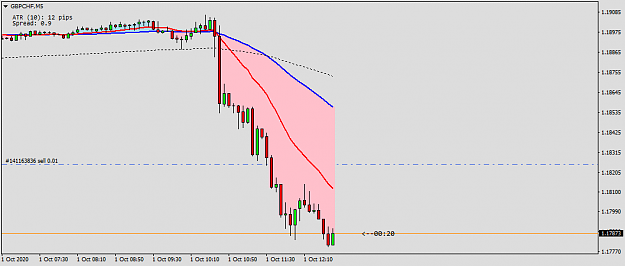
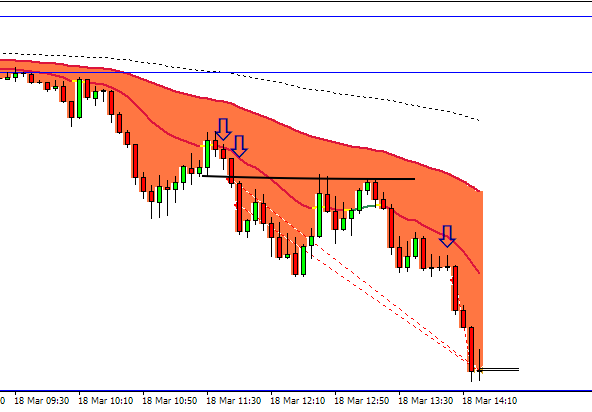
But you didn't know PRICE was going to REJECT the LEVEL, you entered before that. When I look at your 5M, I don't understand your entry. These 2 (blue lines), confirmed SWING HIGHs, make more sense to me: image
Strat's PASR Long Term, Stress Free Trading
- Udkox replied Oct 1, 2020
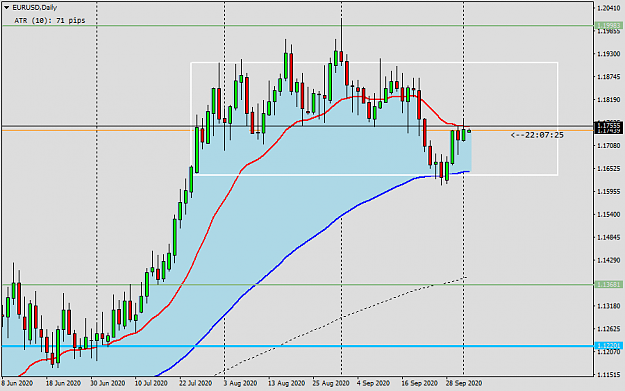
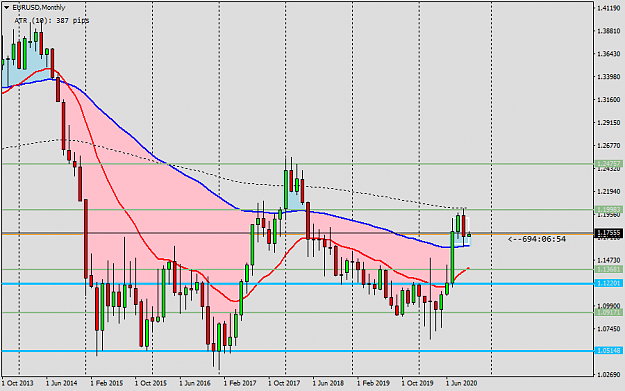
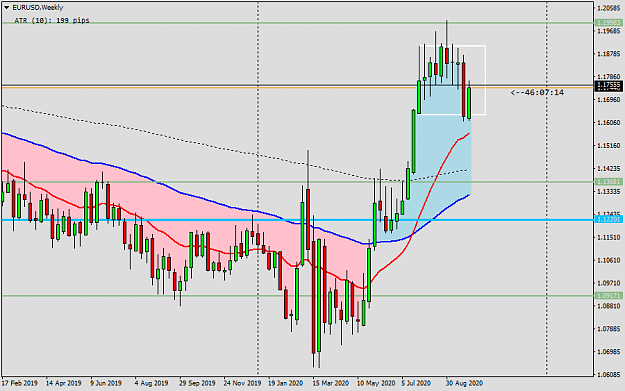
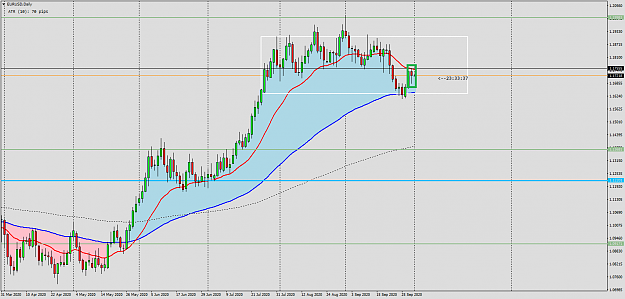
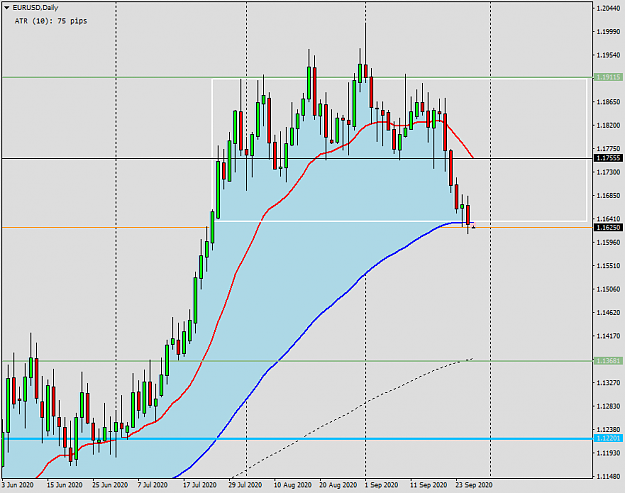
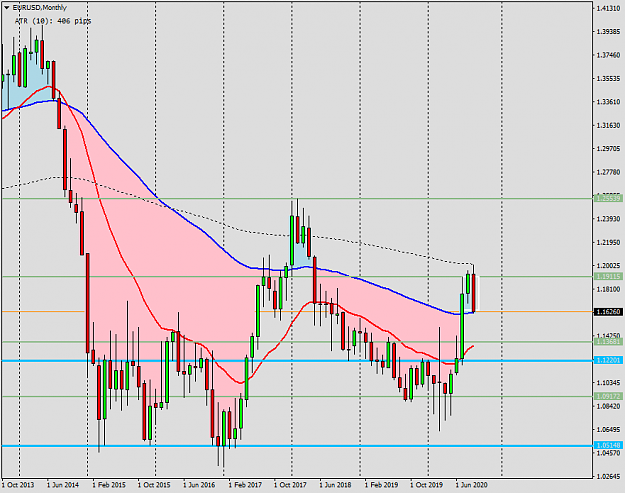
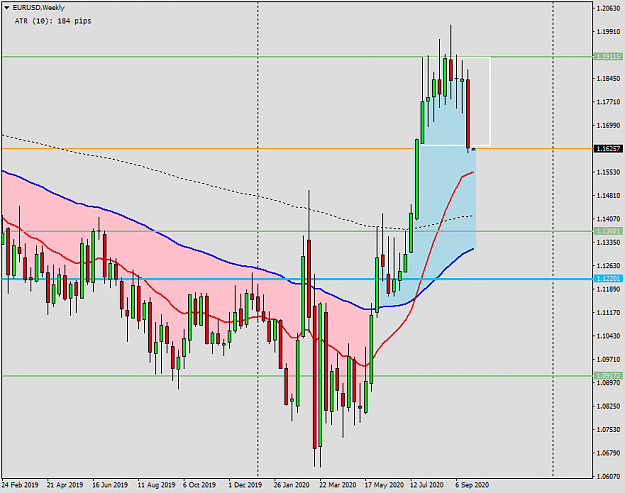
Awesome post Pete, have you got some index on Strat's posts ? I am looking at EUR USD at the moment trying to apply that knowledge. Boss: PRICE in WCC. Huge BEARISH candle finished SWING UP, now on a SWING DOWN. image Worker: PRICE in Strat's ...
Strat's PASR Long Term, Stress Free Trading
- Udkox replied Oct 1, 2020
Hello there! Hope you remember me. You know I am no master but I have a look at your thread
Strat's PASR Long Term, Stress Free Trading I will later reply to the rest too, I just wanted to quickly post this. I was about to close a demo account, but decided to enter a trade first, just to ...
- Udkox replied Sep 30, 2020
Quick question. The way I understand it is that Strat's shadow is: when the shadow is blue/green (PRICE above EMA 72): use bounces off EMA 20 UPWARDS to go long when the shadow is red /brown (PRICE below EMA 72): use bounce off EMA 20 DOWNWARDS to ...
Strat's PASR Long Term, Stress Free Trading
- Multiple lines in a CEditStarted Sep 28, 2020|Platform Tech|0 replies
Trying to have some notes on my charts so I made an indicator that shows a panel with an CEdit. For ...
- Udkox replied Sep 27, 2020
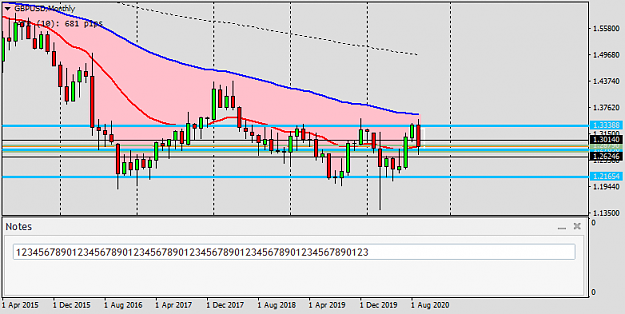
I believe I have found a similar setup as my previous post. Big Boss: Month is about to finish, and PRICE formed a BEARISH ENGULFING BAR on RESISTANCE. After also hitting the 200 EMA. image Boss: PRICE trapped in a WCC. image Worker: PRICE ...
Strat's PASR Long Term, Stress Free Trading
- Udkox replied Sep 24, 2020
Thanks Pete. To be honest, I never understood what footsteps are. I searched for posts that mentioned, it in hopes of finding an explanation, but couldn't find one. Anyway, here my thoughts (ignoring the last candles, which we could not know what ...
Strat's PASR Long Term, Stress Free Trading
- Udkox replied Sep 24, 2020
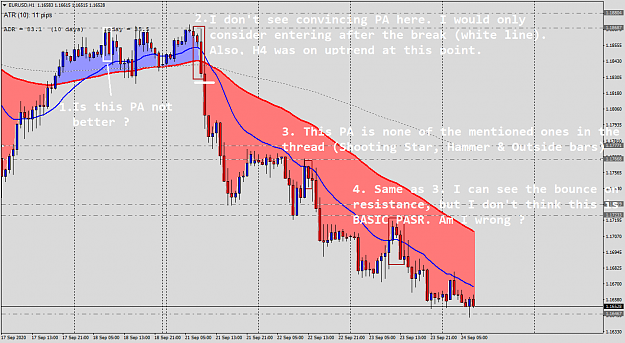
Thanks Mhons. I am trying to identify BASIC PASR in the Daily, as I don't have time to supervise lower timeframes. Since you did post a chart, I do have a couple of questions. They are on the images. Much appreciated.
Strat's PASR Long Term, Stress Free Trading
- Udkox replied Apr 21, 2020
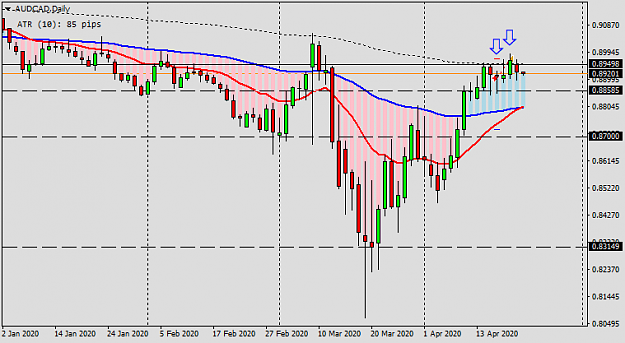
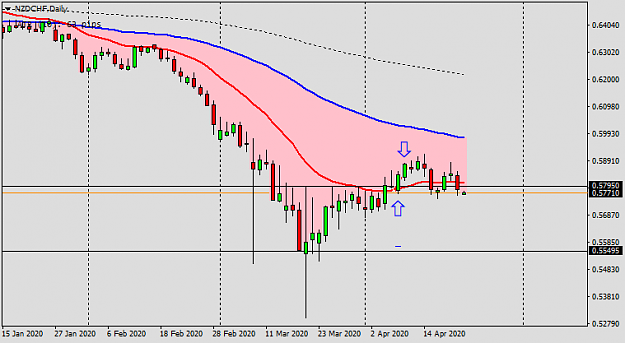
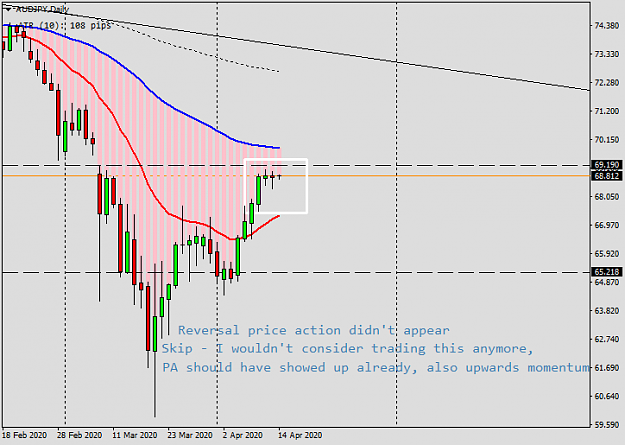
My last 2 trades, both losers. The first one I posted here a few days ago (NZD CHF), the second (AUD CAD) one felt right for once, but didn't mange well. I could have got a green trade in AUD CAD if I got profit on the resistance. I trade 0.01 lots ...
Strat's PASR Long Term, Stress Free Trading
- Udkox replied Apr 13, 2020
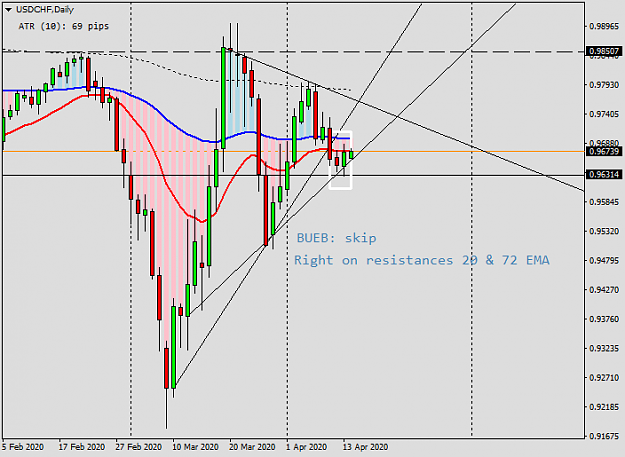
NZD CHF stopped out. Got a list of pairs that could be turning into good setups, but unfortunatelly discarded these 2. Notes on the images. Comments welcome.
Strat's PASR Long Term, Stress Free Trading
- Udkox replied Apr 8, 2020
Thanks Rob, you are right, the Shooting Star doesn't look too good. But I read somewhere that perfect setups don't exist! It does look better in this chart, which is the one I take a peek at when at work. image I agree, all those wicks bothered me ...
Strat's PASR Long Term, Stress Free Trading
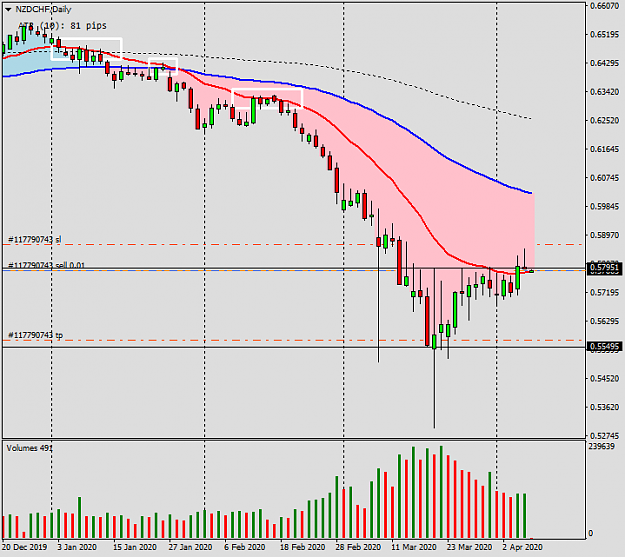
- Udkox replied Apr 7, 2020
This is my second Basic PASR trade I have just taken. Pair is NZD CHF. Why I entered: Price has respected the 20 EMA (red line) in the previous months Very close to the 20 EMA, there is a resistance as well at 0.5795. Price has touched the ...
Strat's PASR Long Term, Stress Free Trading
- Udkox replied Mar 18, 2020
Thanks for that BTS. A few questions if you don't mind: I think the second entry is perfect, right after the candle that confirms a swing high. However, the first one seems a bit rushed. I see that the price was rejected by the 20 EMA, (1) was that ...
Strat's PASR Long Term, Stress Free Trading
- Udkox replied Mar 15, 2020
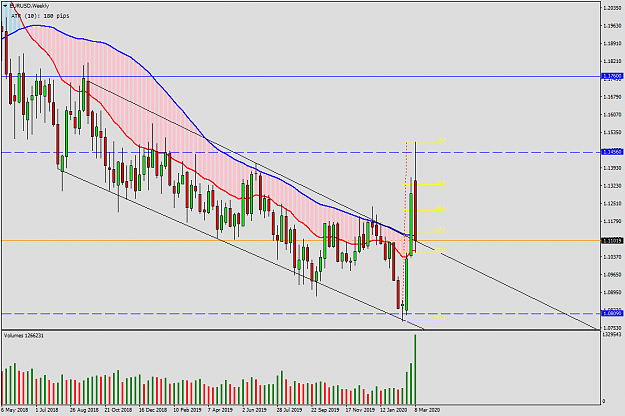
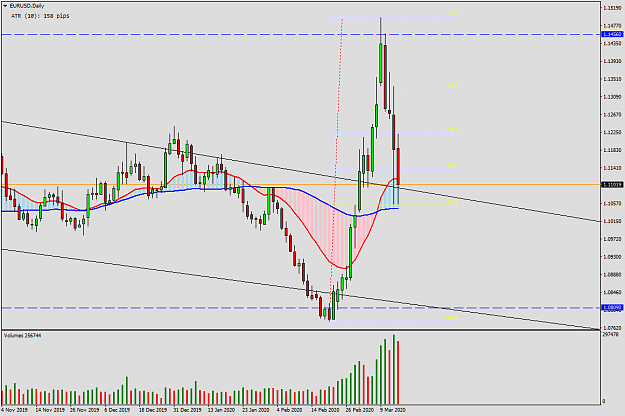
My thoughts on EUR USD [20 = 20 EMA] [50 = 50 SMA] image Price is directionless, between 20 and 50 Volume is huge on the last red candle image 20 very strongly crosses 50, however ... Price is now directionless, between 20 and 50 20 and 50 are ...
Strat's PASR Long Term, Stress Free Trading
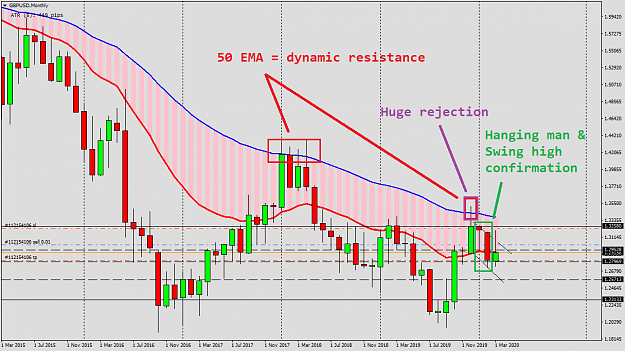
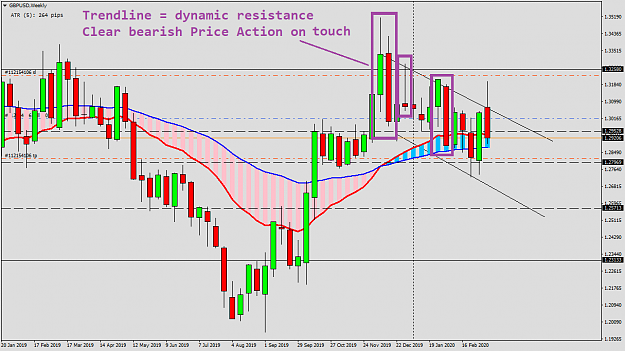
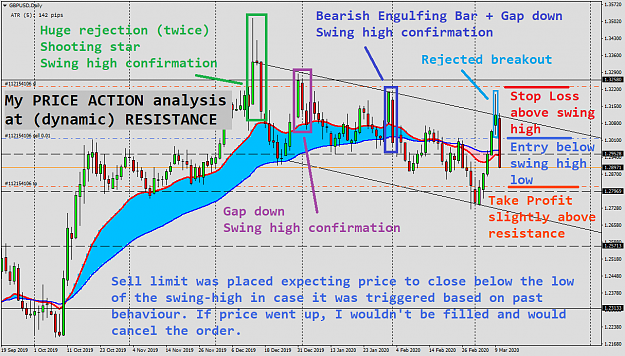
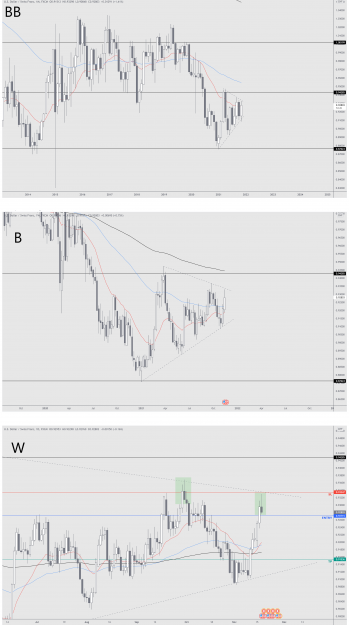
- Udkox replied Mar 10, 2020
Terry, that's how your old indicator worked as well. You just have to change the width of the lines so it covers more space. You can see it happen in my images below as I zoom in. Thanks BTS and Mhons for such explanatory posts recently. Thanks Rub ...
Strat's PASR Long Term, Stress Free Trading