- Search Energy EXCH
- 8 Results
-
 SKadir replied Jun 5, 2017
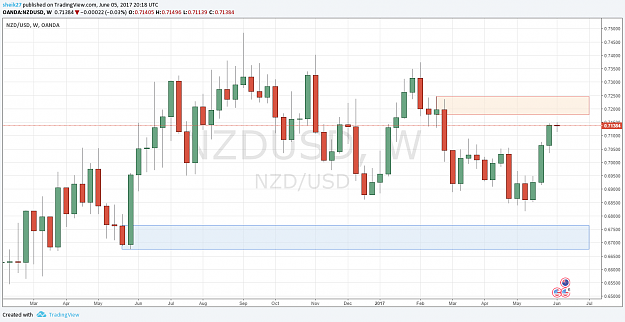
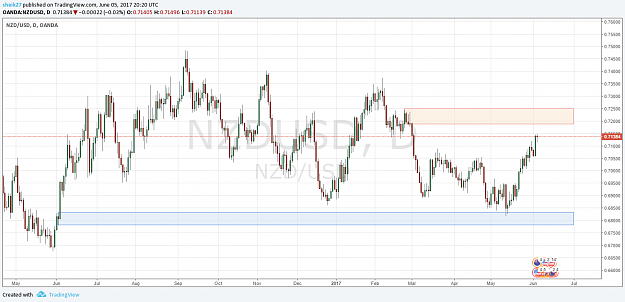
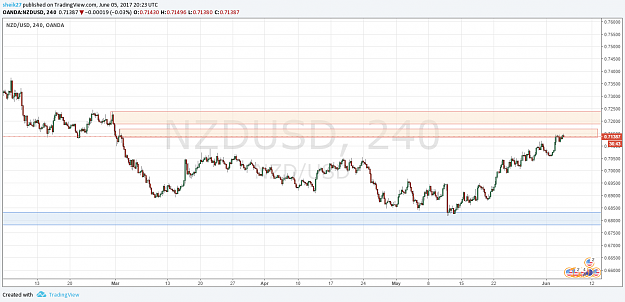
Dear AKT, Could you please take a look at my top down analysis for NZDUSD.. I am planning to look for sell opportunity in the H4 upper supply zone which is inside Weekly supply zone. Weekly: image Daily: image H4: image
Trading Institutional Order Flow
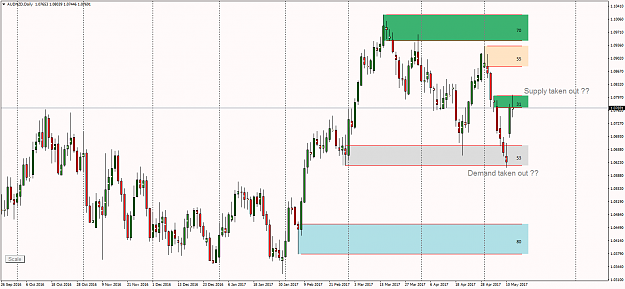
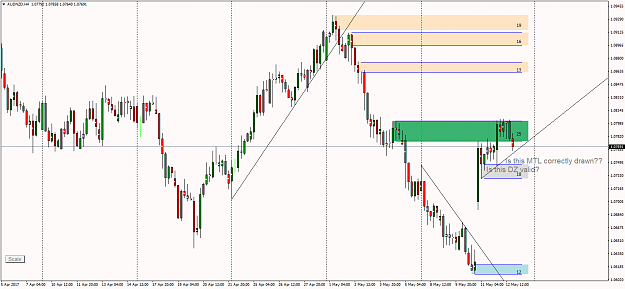
- SKadir replied May 14, 2017
HI AKT, Could you please comment the questions in the charts below: W1: image D1: image H4: image
Trading Institutional Order Flow
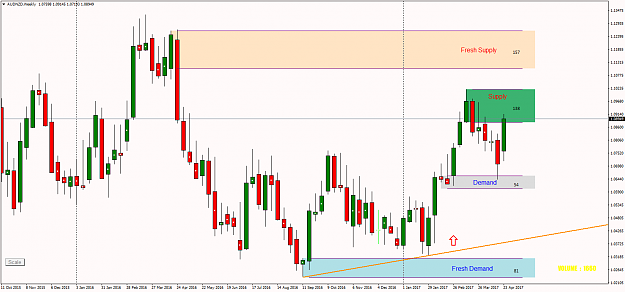
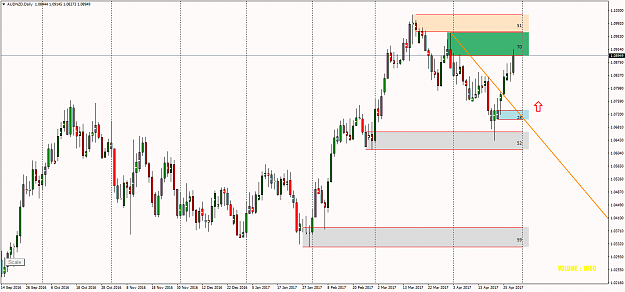
- SKadir replied Apr 30, 2017
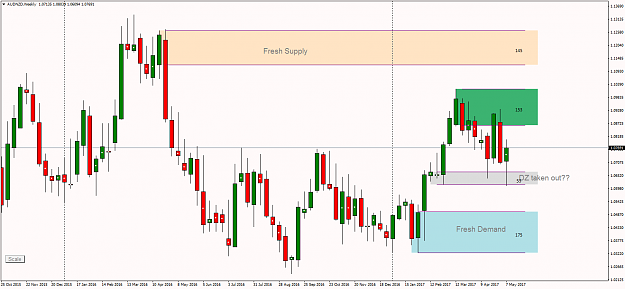
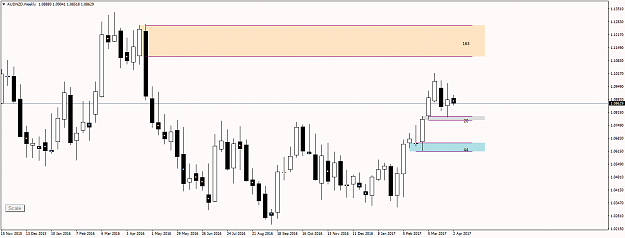
Hello ALL, I missed the webinar last night since I am working night shift....Hopefully next webinar I am free to join. Here is my top down analysis ( probably already discussed last night). AUDNZD W1/D1/H4: W1: Momentum is UP image Daily: Momentum ...
Trading Institutional Order Flow
- SKadir replied Apr 13, 2017
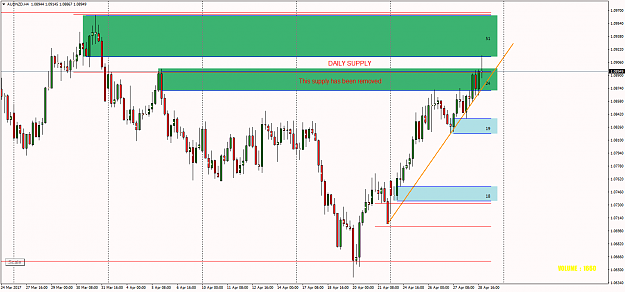
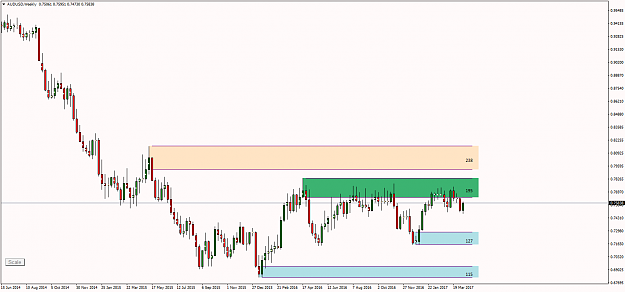
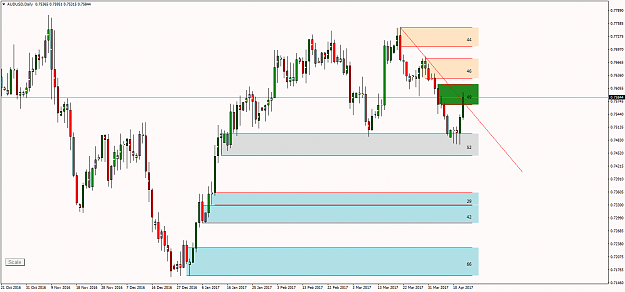
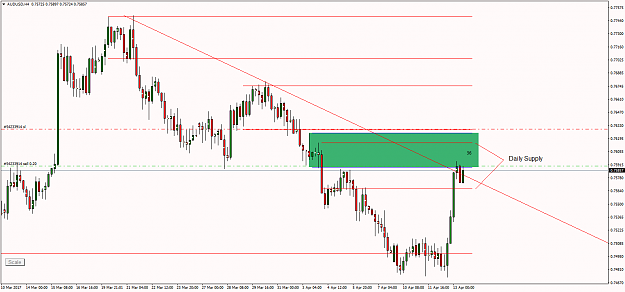
Hello All, Short AUDUSD. Wait for few days for price to come back to the daily SZ then today I took the trade at H4 TF. Please comment as you wish....I am here to learn. W1 Curve: image D1 Momentum: image H4 Entry: image
Trading Institutional Order Flow
- SKadir replied Apr 12, 2017
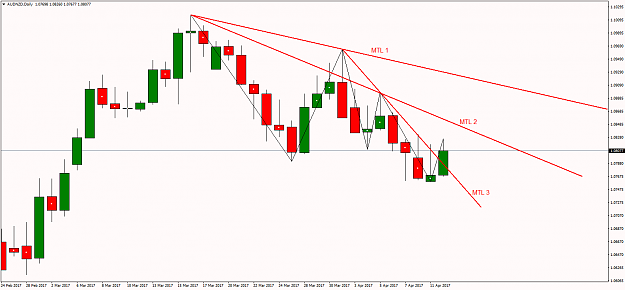
Hello All, I had difficulties in drawing a MTL in daily AUDNZD chart...See attached 3 possible ways I see to draw it. Which one is the correct way to draw it? Thanks. image
Trading Institutional Order Flow
- SKadir replied Apr 4, 2017
Hi AKT, Thanks for your comment. 1. I have re drew the weekly zone, I found the quality DZ lower, I hope it is correct. 2. I also draw higher SZ, the candle I chose for earlier SZ was the candle which reject the SZ above it. I hope the new SZ in ...
Trading Institutional Order Flow
- SKadir replied Apr 4, 2017
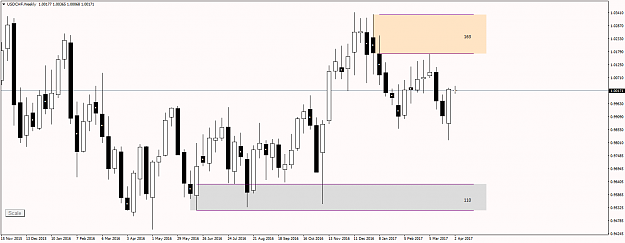
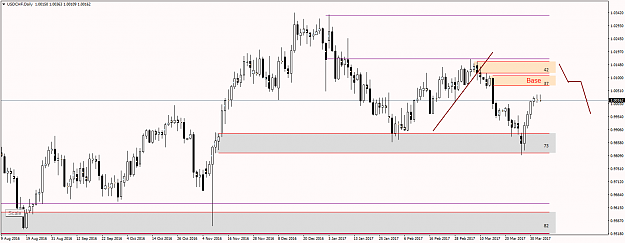
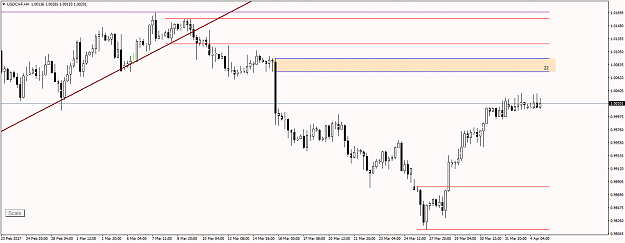
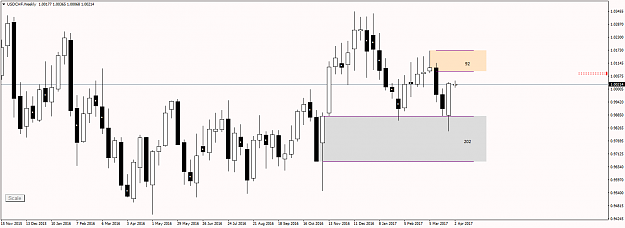
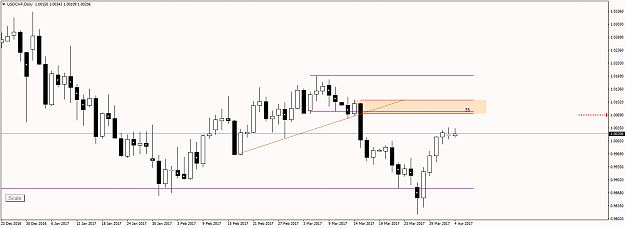
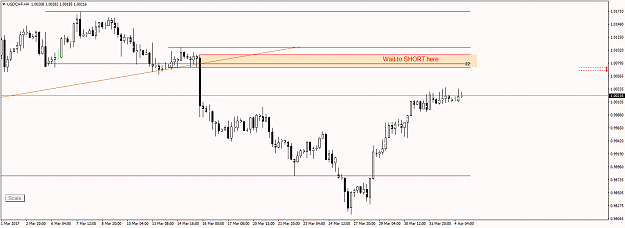
Hello Everyone, USDCHF Here is my top down analysis...W1-D1-H4 Looks like price is heading to a supply zone which responsible for the daily momentum TL breakout earlier. Any comment or correction for my marking on the chart? Thanks in advance.
Trading Institutional Order Flow
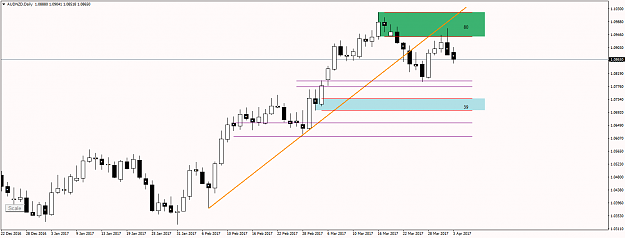
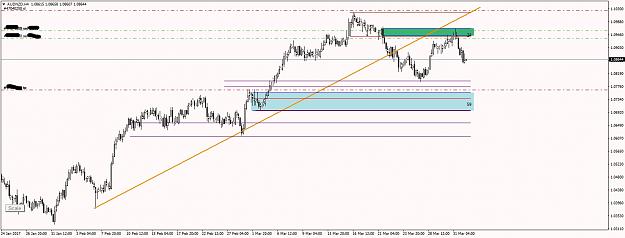
- SKadir replied Apr 3, 2017
Hello Everyone, Need an input on the TP location...Thanks in advance AUDNZD....SHORT W1 - Curve D1- Momentum H4 - Entry and TP
Trading Institutional Order Flow
- Posts by Member Search: 'SKadir'