- Search Energy EXCH
- 44 Results
- Romandan replied Feb 21, 2016
New chances previous months ...............
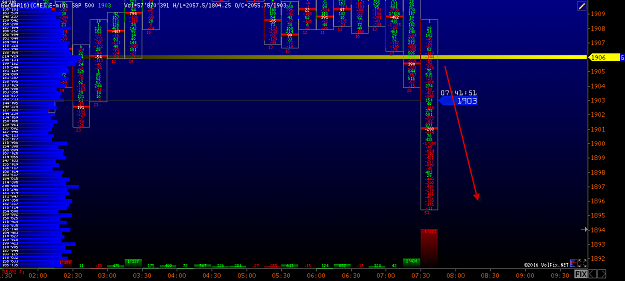
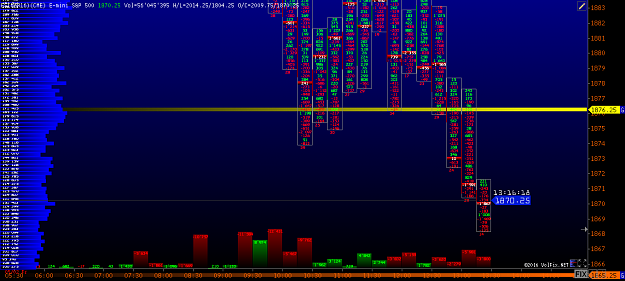
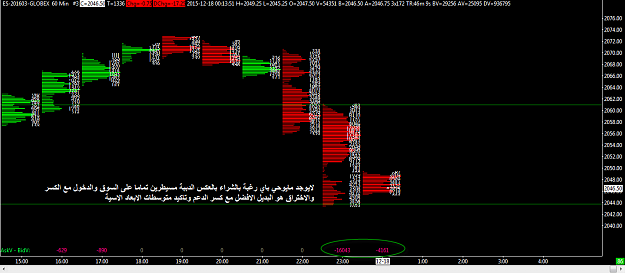
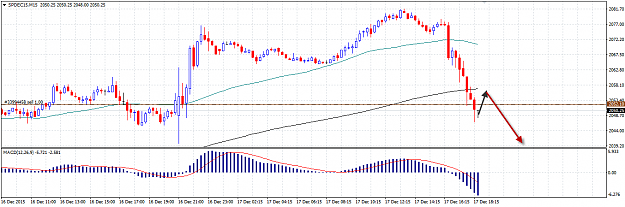
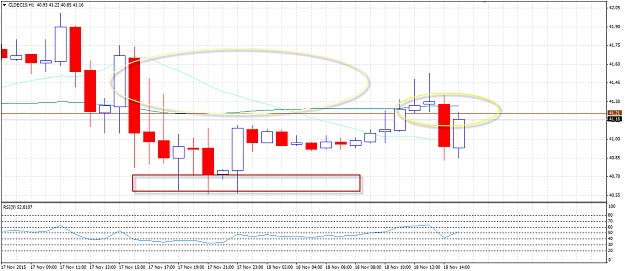
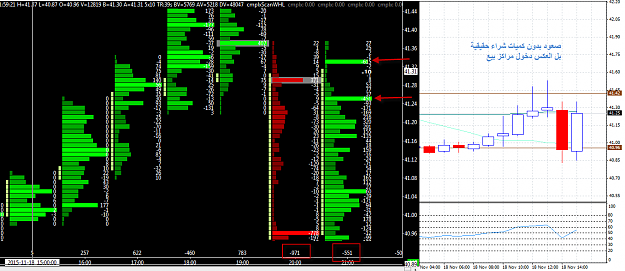
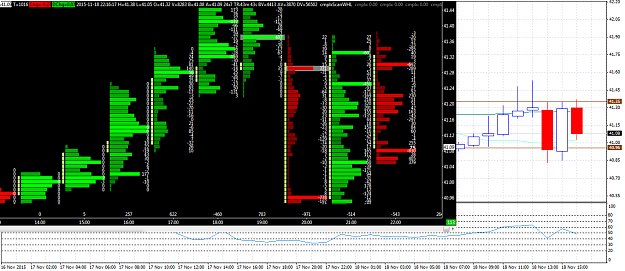
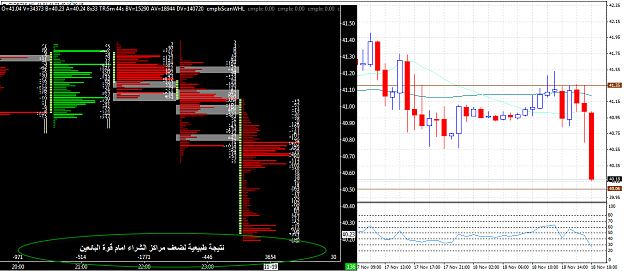
Secret footprint in the markets
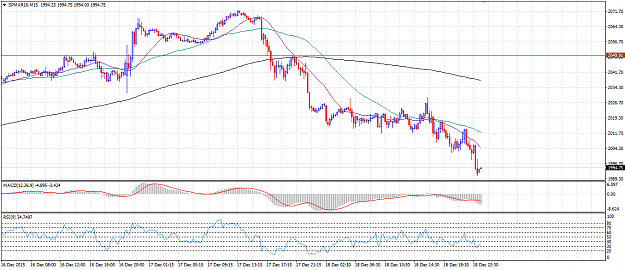
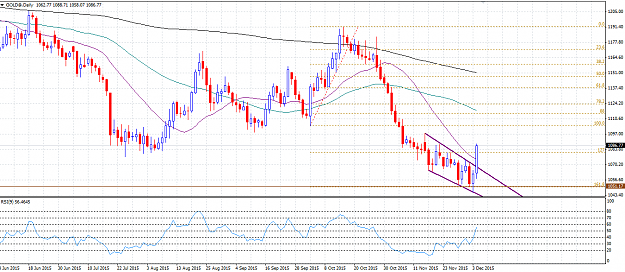
- Romandan replied Dec 6, 2015
Hello .........Guys ...... I am not good writer but i am in forex for long time working with Pension Hedge Fund ..........i Just had attracted by this subject and i would like to share you my info regarding my experince with Footprint ........ * ...
Secret footprint in the markets
- Romandan replied Jan 14, 2011
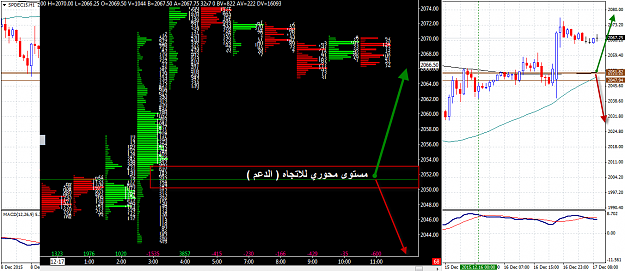
reverse from daily trend line and confirmed my breaking out the small uptrend>>>>>down
Daily GBP/JPY analysis
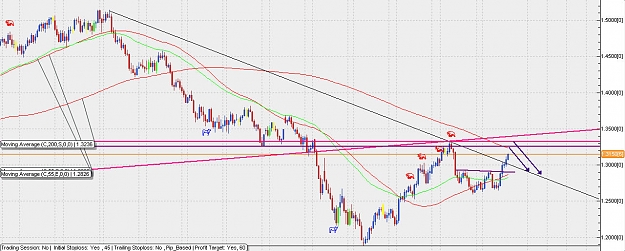
- Romandan replied Sep 17, 2010
the best area to sell EUR/USD @ 1.3260-1.3320 and exit position with daily and weekly candle above 1.3350 and its possible to target 1.29 and 1.27 again.
EURUSD
- Romandan replied Oct 8, 2009
we have around +60 pips we need to break 1.6055-1.6046 to confirm the selling to around 1.5964
Classic Method Strategy
- Romandan replied Oct 8, 2009
Lets return to my second post selling GBP/USD and be informed that i made more than +100 profit and i would explain why i sold the cable ......Just we configure the trend in down trend seeing in daily chart........ Here we saw a strong resistance ...
Classic Method Strategy

- Romandan replied Oct 8, 2009
and finally our target has been mate ..... nothing easier than that i think just we have to practice on filtering for more than one year to success
Classic Method Strategy
- Romandan replied Oct 8, 2009
the same think here with Crazy we figure out that we have a down trend seeing in daily and weekly chart and still up today. SO we would filter our entry with breaking the small trend line supported with moving averages as seen in the chart.
Classic Method Strategy
- Romandan replied Oct 8, 2009
Ok .......after that all we need to do when we decided that we have a down trend we would try to catch up the 4H and 1H tops and bottoms ( resistance and support horizontal lines to enter market with getting help from moving averages and candles ...
Classic Method Strategy
- Romandan replied Oct 8, 2009
check the charts below in Daily Chart it appears that we have a daily down trend line and that mean we would think in selling only.
Classic Method Strategy
- Romandan replied Oct 6, 2009
update...... we have around +90 pips since we post the chart
Classic Method Strategy
- Romandan replied Oct 6, 2009
we wont depend on indicators for making our trades the reason for selling cable to 1.56 could be seen in the chart as long as 1.6215 still hold we will target down
Classic Method Strategy
- Romandan replied Jan 22, 2009
Watch the raly with cable
Trading Naked - Reading Candlesticks and other Price Analysis
- Romandan replied Jan 12, 2009
our traget with selleing GBP/USD has been made with +200 pips also EUR retest the broken support and traget more than +200 >>>all of this by reading the candlestick
Trading Naked - Reading Candlesticks and other Price Analysis