- Search Energy EXCH
- 22 Results (1 Threads, 21 Replies)
-
 PuttPutt4x replied Nov 2, 2017
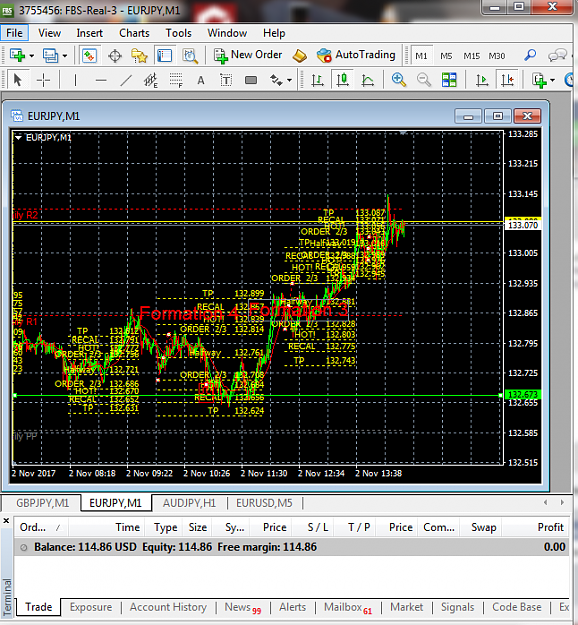
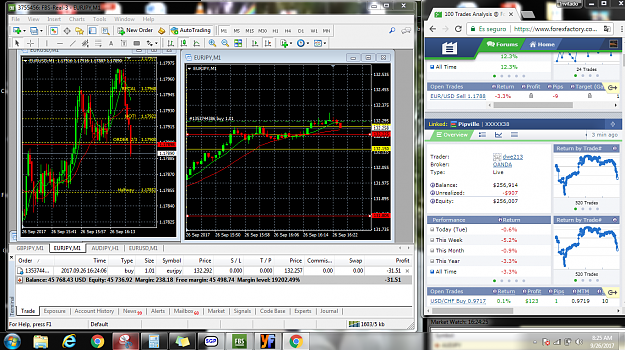
Where is this trading lining up now? Within the picture, it shows that you have shorted, at what is the low of today's price action at the time. Now, being you don't have a sl, where would it be in this case? image So the green line is where you ...
Buy above yesterday high sell below yesterday low
- PuttPutt4x replied Oct 27, 2017
So many people are buying EUR into the close. Would it be safe to say that it gaps down? image
EURUSD only

- PuttPutt4x replied Oct 26, 2017
Amazing reversal the last 10 mins on EU. A cup and handle formations would be the one the sellers aren't expecting! image
EURUSD only

- PuttPutt4x replied Oct 22, 2017
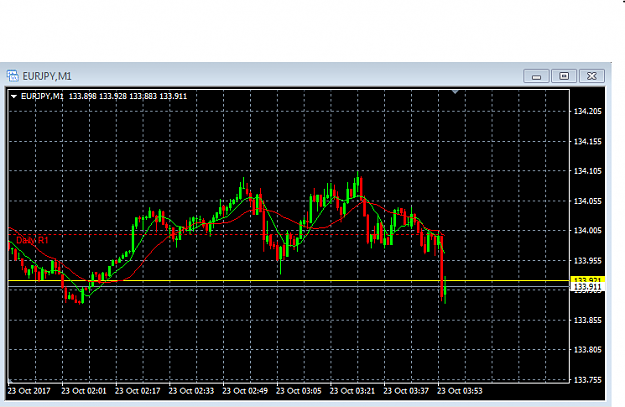
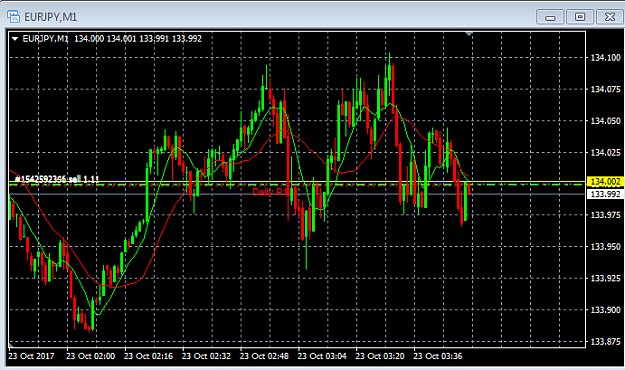
What would you call this? image
Choppy market index: any good ideas?

- PuttPutt4x replied Oct 17, 2017
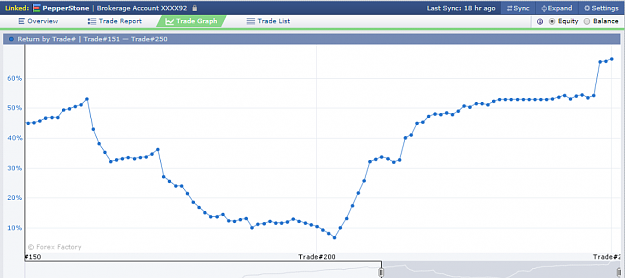
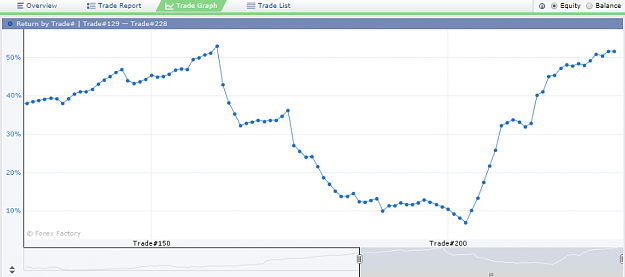
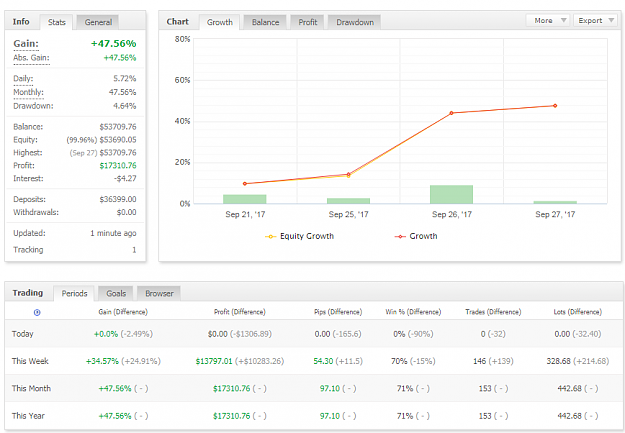
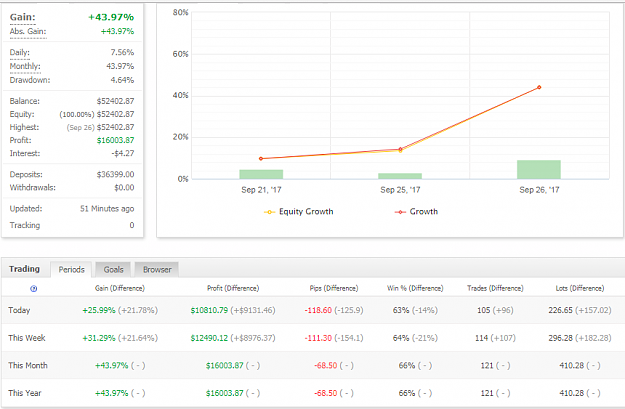
Cup and handle formation coming up for my equity curve. image
100K goal before Christmas
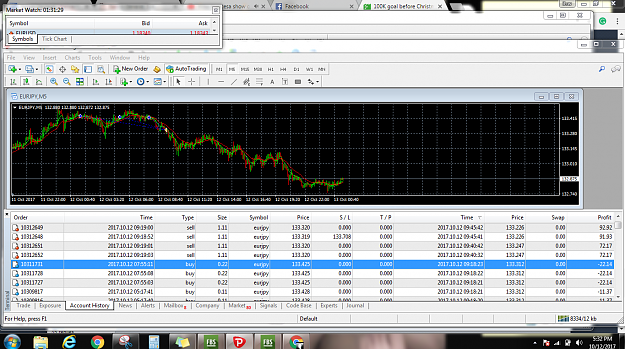
- PuttPutt4x replied Oct 13, 2017
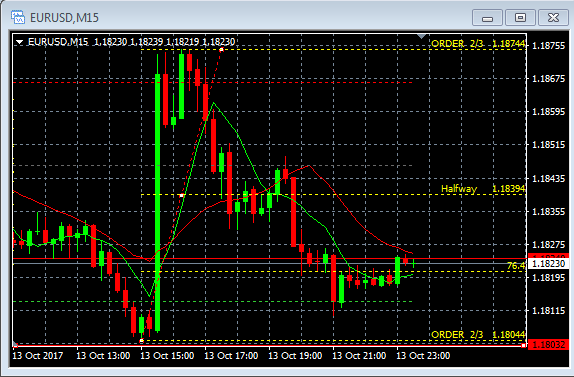
Look at how the current price is reacting against the HIGH of the candle which was first to touch the 76.4
100K goal before Christmas You don't buy unless it closes across it on the 1m. image
- PuttPutt4x replied Oct 13, 2017
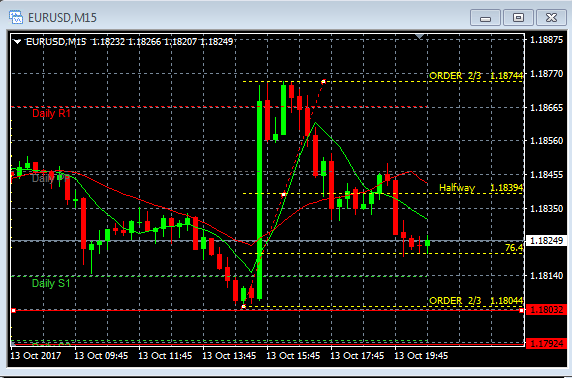
Here is the 76.4 fib level. image Whenever I see a massive breakout candle on the 1m (a candle which is at least 4x the hourly range) I then calculate the high and low of the move once my 2 ma lines cross. Once that occurs, I simply wait for a ...
100K goal before Christmas
- PuttPutt4x replied Oct 12, 2017
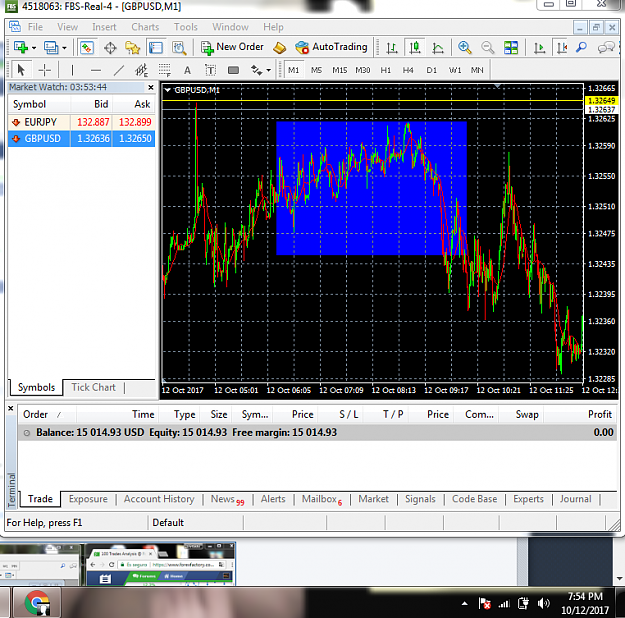
By looking at your 15m chart I can tell you entered within this range. Clearly when the CLOSE across the last low of the accumulation to the upside, you got bias with a 76.4 fib rejection of the spike upward. The lower the TF the more formations you ...
100K goal before Christmas
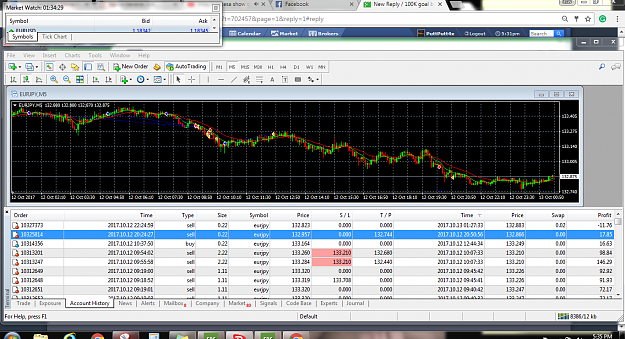
- PuttPutt4x replied Oct 12, 2017
Hello everyone, image Here you can see the buy order slowly started to fade. Most people would have allowed their position to go further in red and allow it to come back to them. However, I decided to respect the sl of the buy then reverse to a ...
100K goal before Christmas
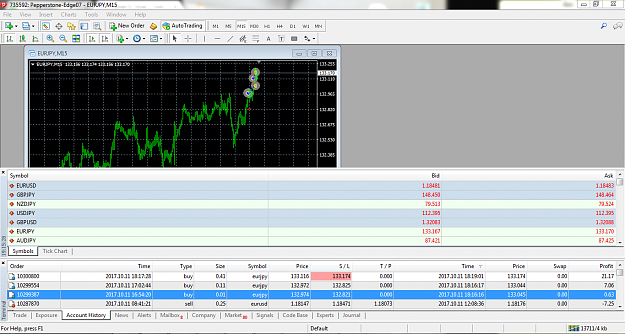
- PuttPutt4x replied Oct 11, 2017
image On what has turned out to be a quick burst to the upside, we were able to enter during a very flat period after a breakout. 15m shows one thing and the lower shows something totally different. So would you rather follow the action live or ...
100K goal before Christmas
- PuttPutt4x replied Sep 28, 2017
Slow day today. I couldn't find one formation worth risking anything more than 1% of my account on today. image
100K goal before Christmas
- PuttPutt4x replied Sep 26, 2017
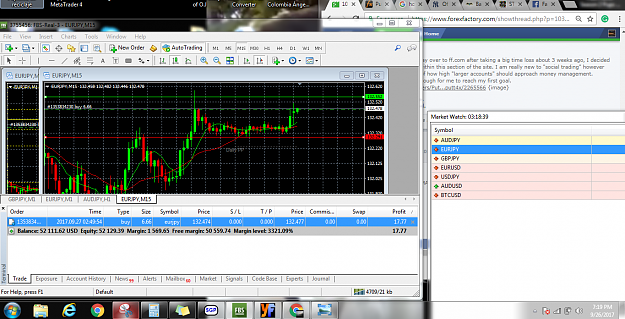
TP for call number one was hit before sl.
100K goal before Christmas
- PuttPutt4x replied Sep 26, 2017
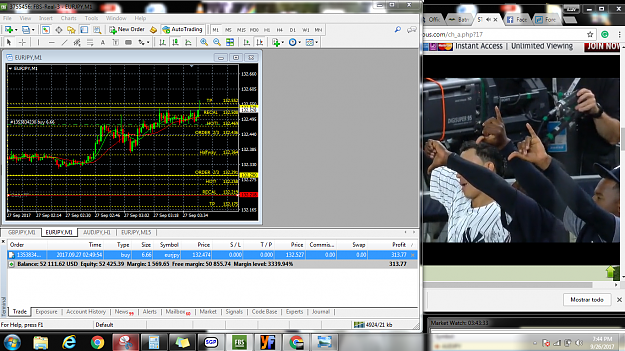
First call image I am long. TP is the green line. SL is the red line in which the price only has to close there for at least 3 mins ----------------- If sl is hit before TP, i will simply short for a larger lot size, as the sell would be the money ...
100K goal before Christmas

- 100K goal before ChristmasStarted Sep 26, 2017|Recycle Bin|36 replies

Hello everyone, After making my way over to ff.com after taking a big time loss about 3 weeks ago, ...
- PuttPutt4x replied Sep 25, 2017
4.2 pips left to fill the gap is comparing the distance of the Earth to the Moon. I say that, only because THEORY of what is considered a touch of a price can cause a lot of confusion. We can see here on the chart, that the gapped price and the ...
EURUSD
