- Search Energy EXCH
- 19 Results
-
 PipPilot replied Nov 26, 2008
TS uses Gain Capital on their back end. I typically only see gaps on Sunday open on any timeframe. Spread is not fixed. One thing to consider is the data that is actually plotted on your chart. TS only plots the bid.
EURUSD
- PipPilot replied Nov 20, 2008
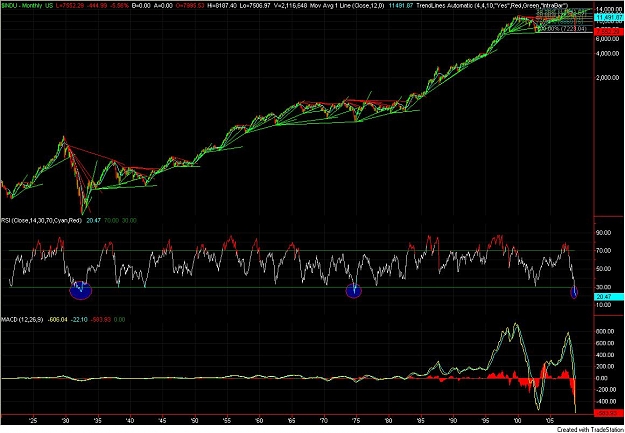
I think what is interesting is that we just undercut the 1973-74 45% correction and are now at 47% on the Dow. The 1929-32 bear was 89%. For fun I looked at the monthly going back to the 20's and threw a RSI onto it. We have now dropped below the ...
EURUSD
- PipPilot replied Nov 20, 2008
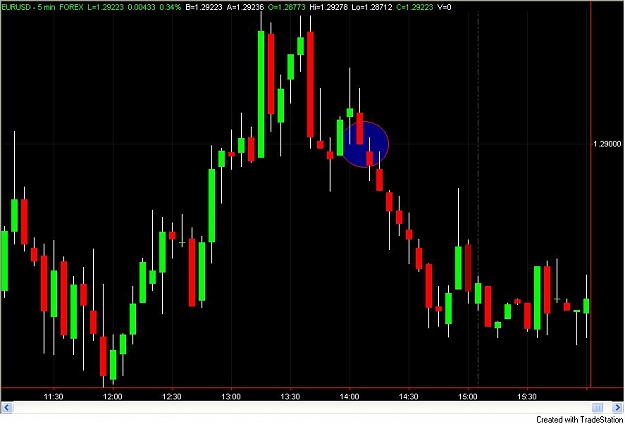
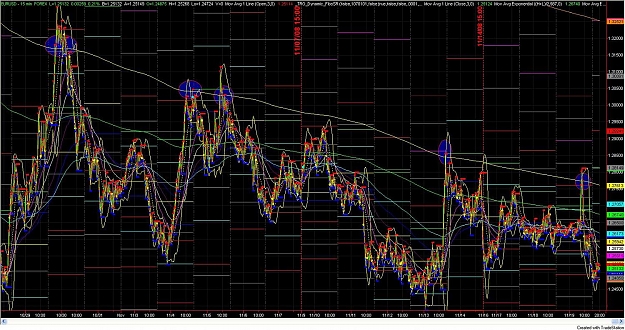
15M 377 EMA — Nice hit on the 15M 377 EMA (another fib number) which correlated nicely with the pivot and 2600 psych level. Short entry at 2591 with 2 lots. First TP at 2505 close to M2 for 86 pips, stops to entry with second lot still running.
EURUSD
- PipPilot replied Nov 19, 2008
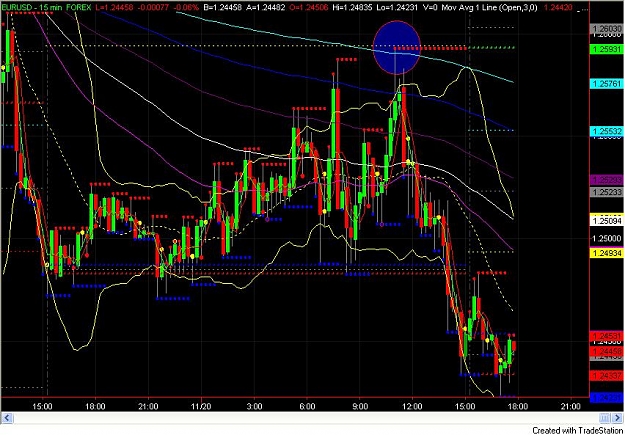
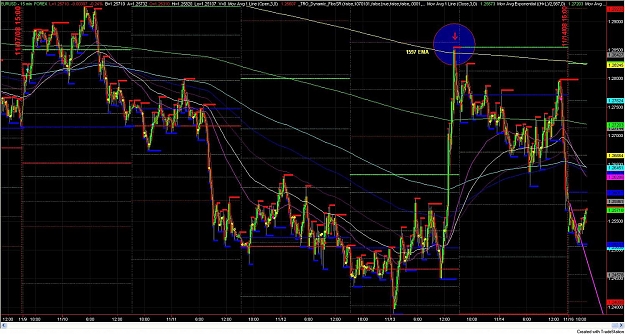
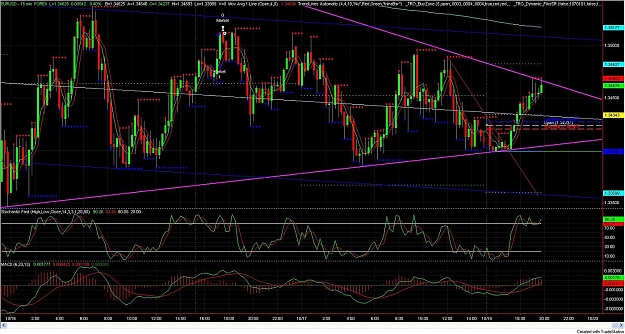
EMA's or Emu's for EU...? — Sun, just because you love my 15M 1597 (yellow line) Fib EMA (16.64d EMA) so much...
EURUSD Was good to me again today... Every time we have have hit this EMA since the pullback to the 3300 level back at the end of Oct, ...
- PipPilot replied Nov 16, 2008
See attached image. I use TradeStation for my charting, and can use any value or formula.
EURUSD
- PipPilot replied Oct 30, 2008
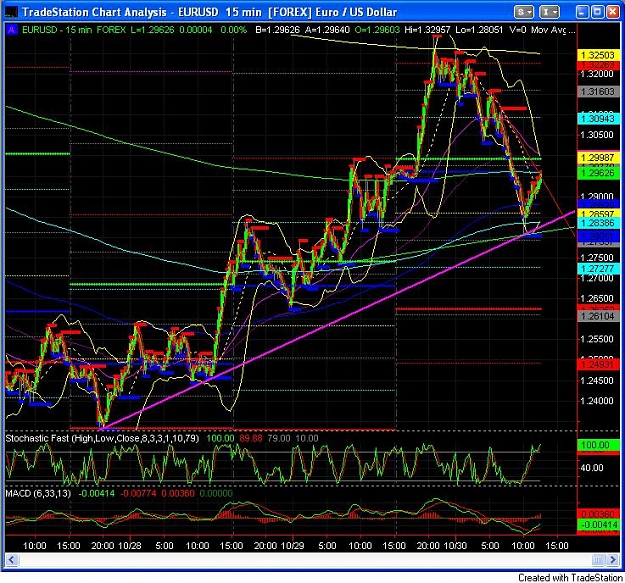
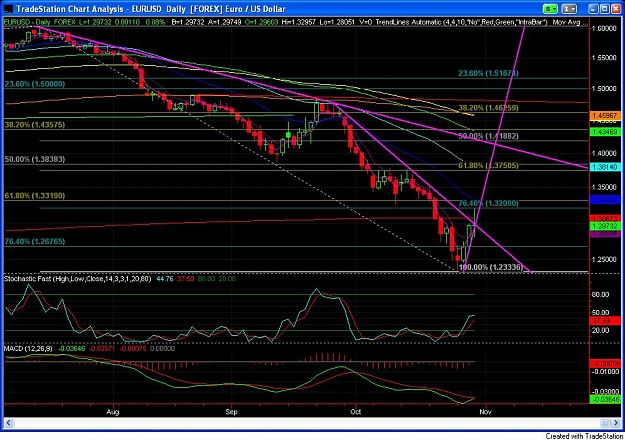
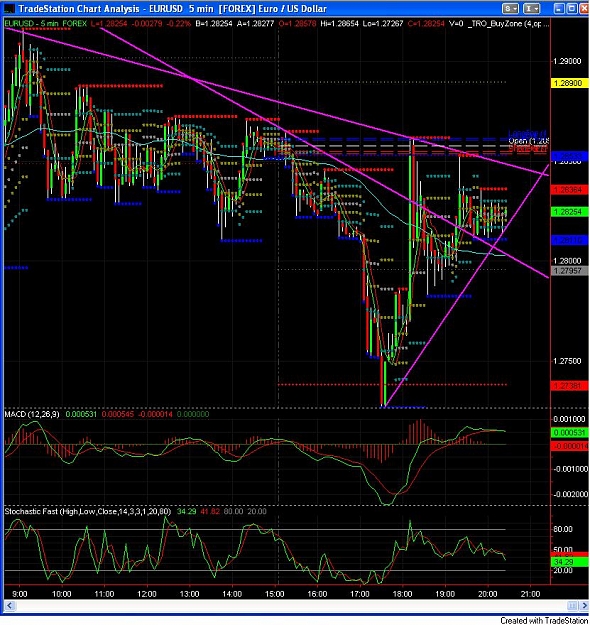
To Reverse or Not... — I watching to see if we reverse short term (or not). The 15M has found a strong support trendline for the past few days (and a nice 4H channel), and the EMA's are starting to re-order on the 15M. The daily tested a ...
EURUSD
- PipPilot replied Oct 26, 2008
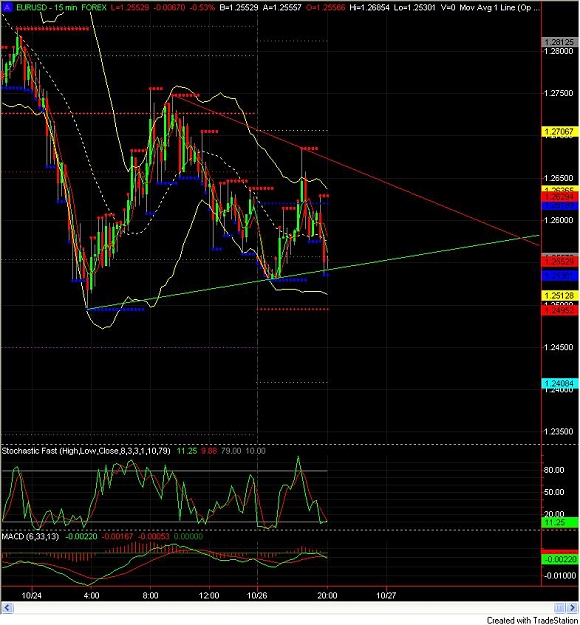
Thanks — Thanks, and I think we won't know breakout direction until London. Symmetrical triangle forming (or possibly descending wedge if we re-test 2495, which was Friday's low) on the 15M. BB's (Bollinger Bands) are primarily within ...
EURUSD
- PipPilot replied Oct 22, 2008
Nice thing about bull/bear market is that both have corrections as nothing is linear. I use 5PM ET to calculate pivots and use that to determine my entries. Nice bounce off the close from 5PM ET today and range bound by the open at the same time. I ...
EURUSD
- PipPilot replied Oct 19, 2008
Pretty much Acumen's style with pivots and the bias (long or short) set by the pivot point (PP) on a 15M or 5M chart. But I augment this with a valid trendline (at least 3 touches; the more the better). I also use an indicator by TRO (you can search ...
EURUSD
- PipPilot replied Oct 14, 2008
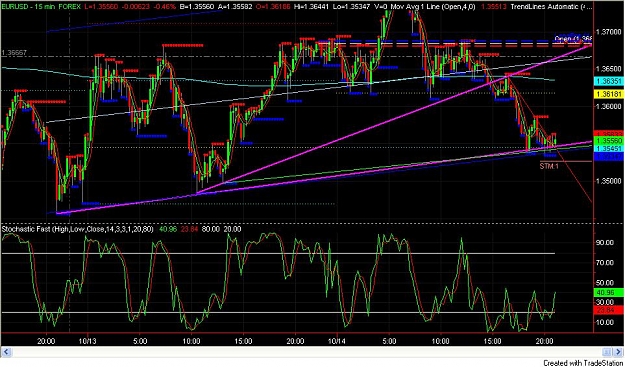
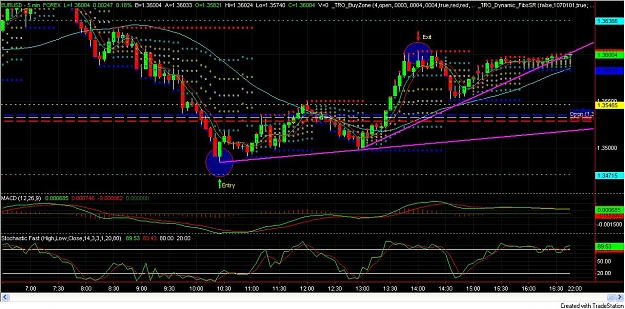
Hanging Out in Vegas and Watching EURUSD Paint Dry — I have a long entry at 3550 around S1 with a tight SL for a 1st profit target at 3600 and 2nd at 3700. Nice trendline on the 15M with 3 hits since Sunday and a nice wide 4H trading channel ...
EURUSD
- PipPilot replied Oct 13, 2008
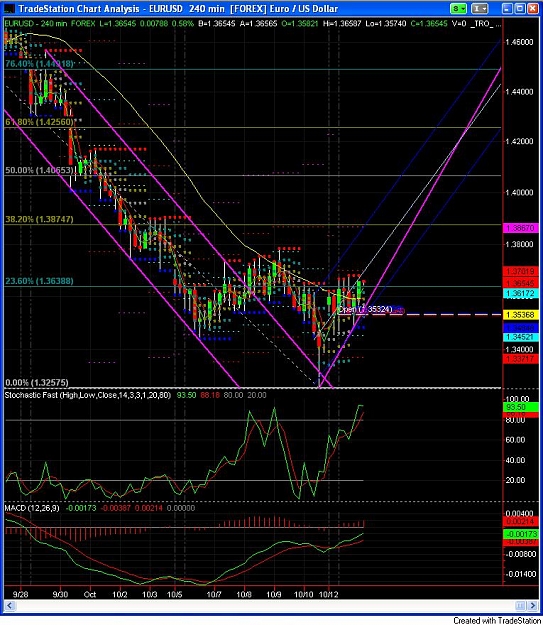
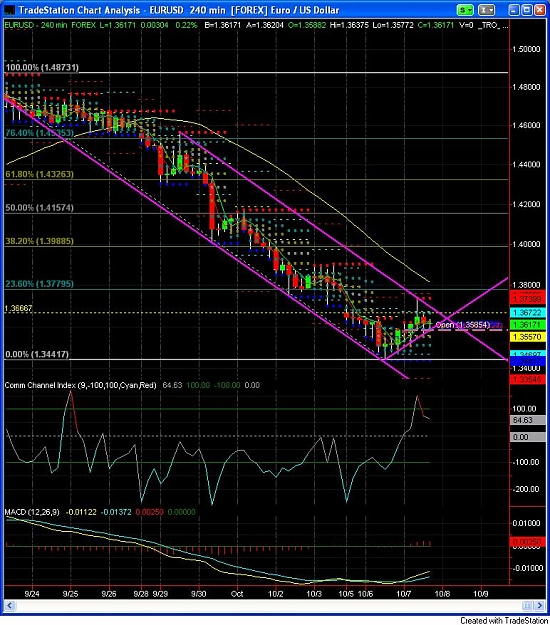
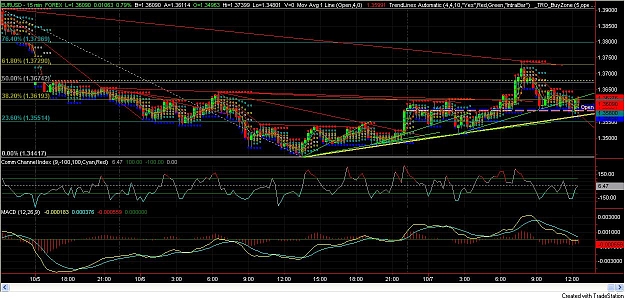
4H Channel — Actually nice channel forming on the 4H chart with the first 23.6% fib hit at 1.3639. If that trend continues there might be a nice channel to trade in up to 38.20% fib at 1.3875. Fib retracement being looked at is 9/22 (1.4866) ...
EURUSD
- PipPilot replied Oct 13, 2008
Thanks Acumen — Watched your videos this weekend. Good strategy. Had not really considered pivot points as part of my strategy. I have combined that with a more simplified trend following (trend line and regression channel) method, which ...
EURUSD
- PipPilot replied Oct 8, 2008
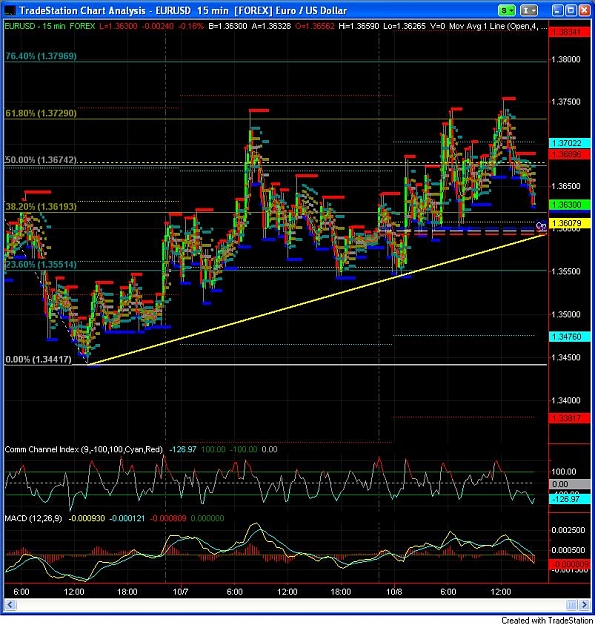
Uptrend — I still see a valid uptrend on th 15M with support around the pivot (PP) in the 3610 area. 4H confirms a broken channel and a consolidating ascending triangle. That lower 4H upsloping trendline is strong as is the overhead resistance ...
EURUSD
- PipPilot replied Oct 7, 2008
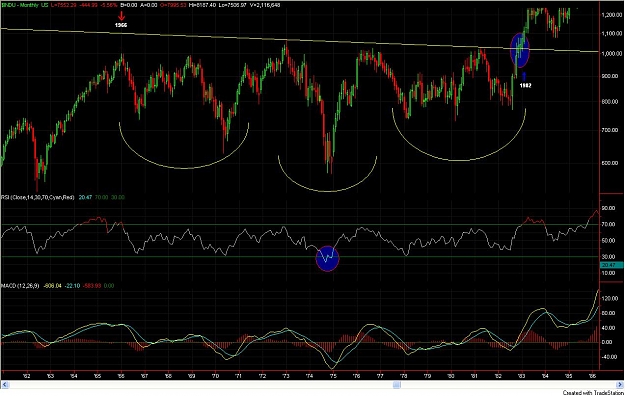
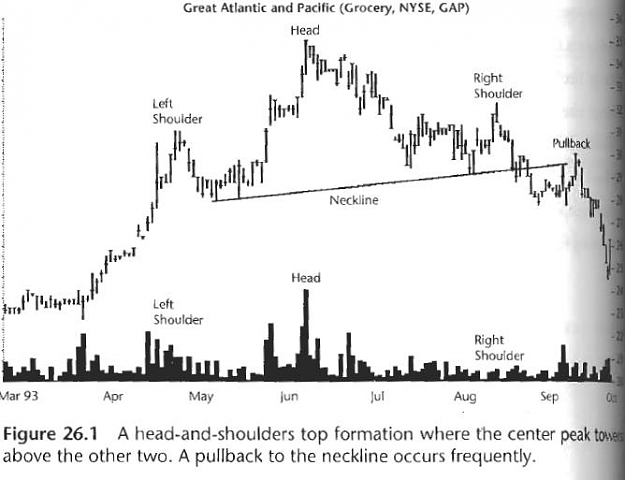
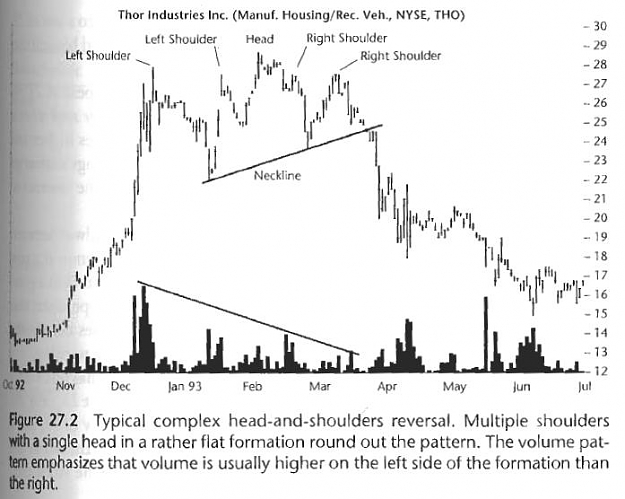
H&S — Sure. Credit goes to Thomas N. Bulkowski, "Encyclopedia of Chart Patterns", Second Edition. One normal and one complex.
EURUSD
- PipPilot replied Oct 7, 2008
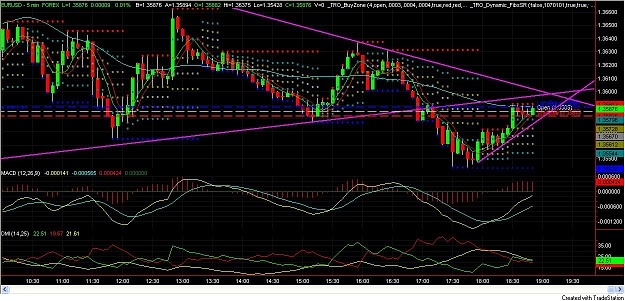
Hit a support pivot at 1.3555 and has retraced back to trend line it broke previously. 1.3591 is current resistance upward right along that previous trendline. Argeed that entry here is risky. Could break either way. Better to wait for confirmation.
EURUSD
- PipPilot replied Oct 7, 2008
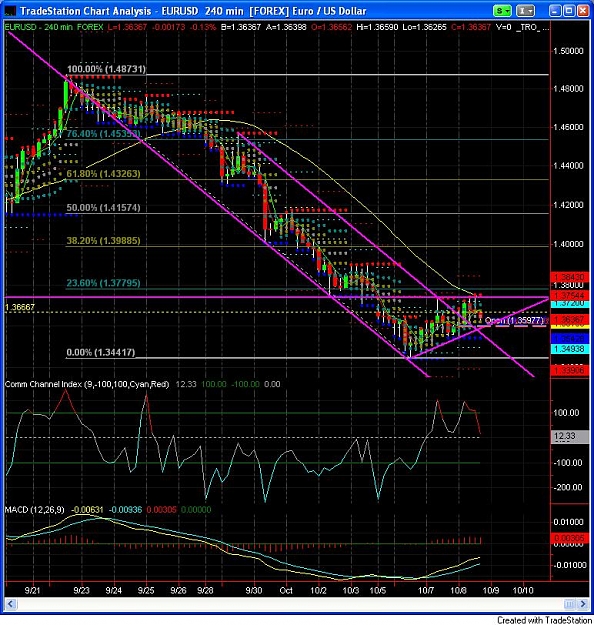
4HR Channel — 4 hour chart is finally showing a nice channel with two parallel lines and an up trend correction within the channel. 1.3667 could come into play on the upper channel trendline, which is also pretty much on the R1 pivot, which ...
EURUSD
- PipPilot replied Oct 7, 2008
Strong Uptrend Line — Area around 3600 is still a long term support area on the weekly chart. Price has congested here several times going back to 2005 and 2007. Dangerous area that could spell either support or resistance. For the short term ...
EURUSD
- PipPilot replied Oct 5, 2008
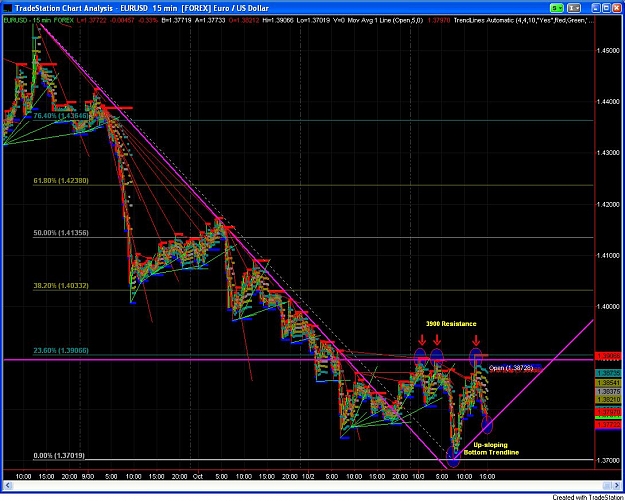
15M Ascending Triangle — 15M chart for the week provided for a very strong downward sloping trend with several touches during the week. This trend line was finally broken Thursday evening and the pair has moved into a potential consolidating ...
EURUSD
- PipPilot replied Oct 4, 2008
Depends on if you are looking at a linear or semi-log chart. Semi-log chart clearly shows the break on both the weekly and monthly. Agreed that the area around 1.3666 provides a strong area of support that could be tested a few times before the down ...
EURUSD

- Posts by Member Search: 'PipPilot'