- Search Energy EXCH
- 7 Results
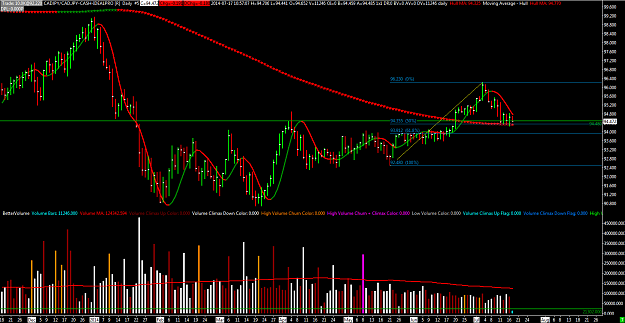
- Pip Singh replied Jul 17, 2014
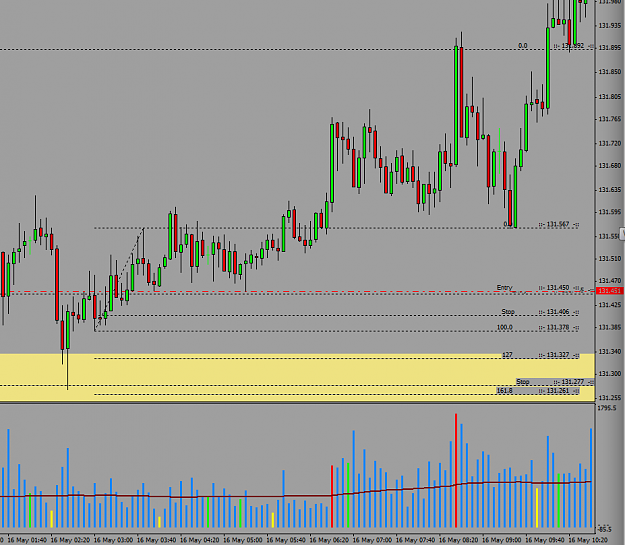
it seems we a stopping volume on the CAD.JPY with a shakeout. Interesting volume for the SV, because its the largest volume since 18/6/2014 (Start of Uptrend). Could we see another leg up? Also, something to note, on the daily it looks like were on ...
vsa with Malcolm
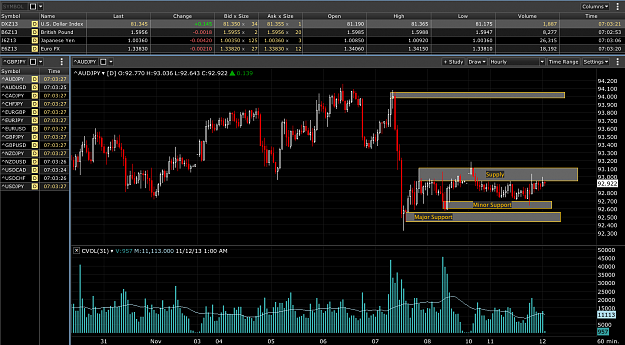
- Pip Singh replied Nov 12, 2013
Hello Everyone, Just my analysis of how interpret VSA (please don't shoot-me if its wrong
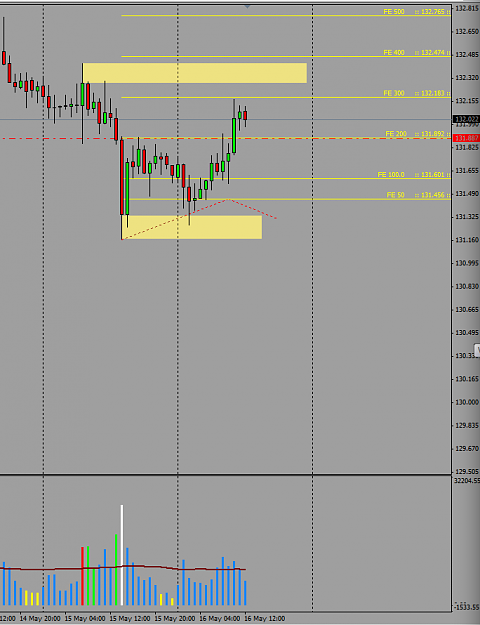
vsa with Malcolm ). I think the AUDJPY is currently in accumulation mode but with minor supply coming into the market from 7/11, 10/11, 11/11. However, I believe demand is ...
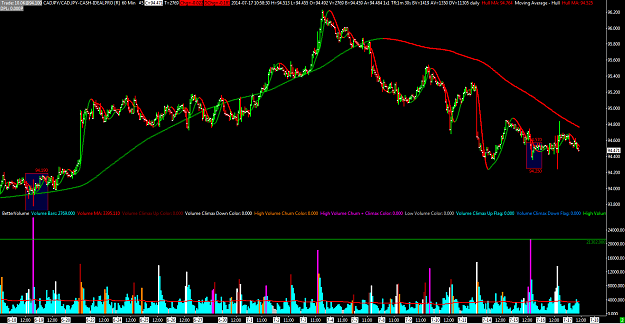
- Pip Singh replied May 16, 2013
Thanks Joaoborras, My main approach is VSA. Currently, I only daytrade but I have had really good results in the past couple of months using this method. I find using Daily and 4 hour charts as background info is good but not critical unless you are ...
vsa with Malcolm
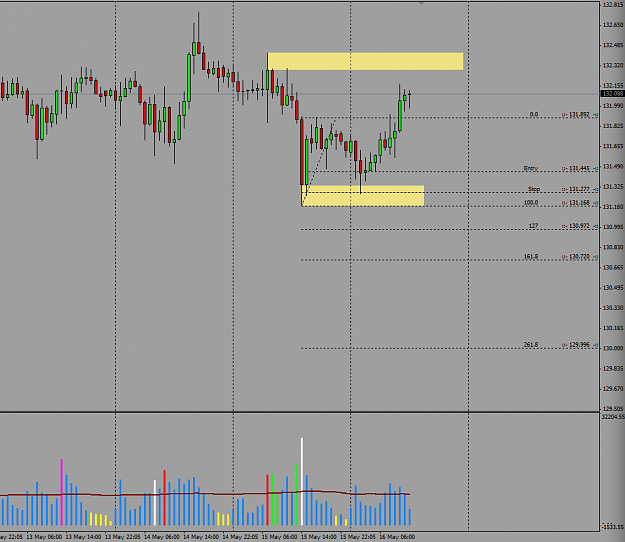
- Pip Singh replied Mar 28, 2013
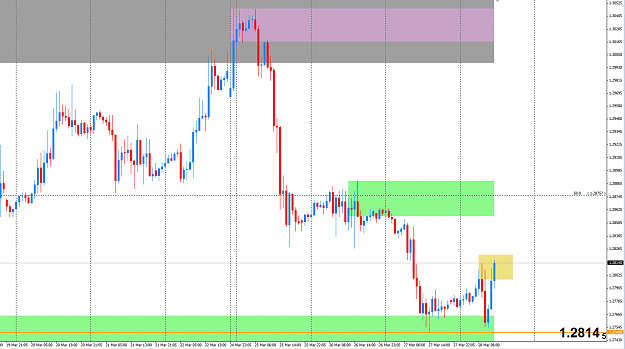
Hello everyone, This price action bounced of a known demand area from 21st November 2012. The green boxes are supply/demand levels from a 4hr view. The yellow box is the 50-61.8% retracement. I wouldn't be surprised if price went up to 1.28600 to ...
Trading EURUSD only
- Pip Singh replied Feb 6, 2013
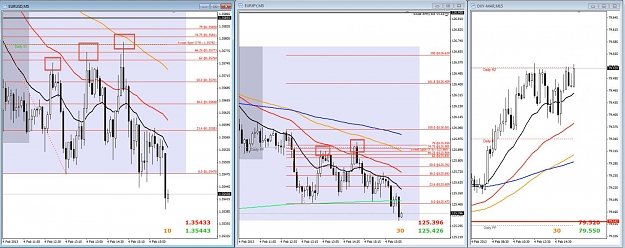
We could see a bounce off the 1.3500= to 1.3490 level. This coincides with 70.5% fibonacci retracement from the 4hr chart and daily.
Trading EURUSD only

- Pip Singh replied Feb 4, 2013
Hello All, Today, technically the slight reverse on the EUR/USD is correct. Today was an obvious sell day which can be determined by the USD Index. Also, for me to understand a day before wether its going to be a buy day or a sell day, I use the ...
Trading EURUSD only
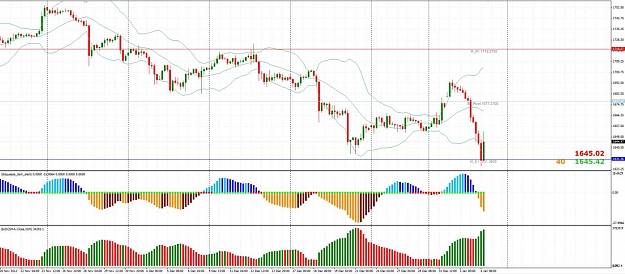
- Pip Singh replied Jan 4, 2013
Yea, defiantly reversing. Next major support is the monthly at 1631. Pip Singh image
All Majors and Gold
- Posts by Member Search: 'Pip Singh'