- Search Energy EXCH
- 5 Results
- Mtm replied Mar 22, 2011
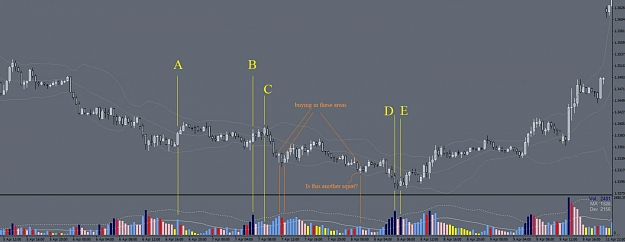
Hi HG, so unless we do a bar-by-bar analysis, we would not likely have spot the squat there,... these kind of squat are difficult to spot when the vol is not UH / significant. When you mentioned "previous interval", do you mean the bar that appears ...
vsa with Malcolm
- Mtm replied Feb 25, 2011
Hi supremeChaos, Can i know how do you tell from the chart that there is potential pushing thru supply..? and how do you tell they are finding buyers at lower prices? Thanks! Hi juhanimi, can i know what makes you think "SM is not with this up move" ...
vsa with Malcolm
- Mtm replied Feb 22, 2011
thanks for the reply. (side track a bit) I had tried to look into pnf to 'calculate' the accumulation/distribution area to see how far it will move the price.. also to see if it can work with vsa.. but im still not quite understanding how to come up ...
vsa with Malcolm
- Mtm replied Feb 20, 2011
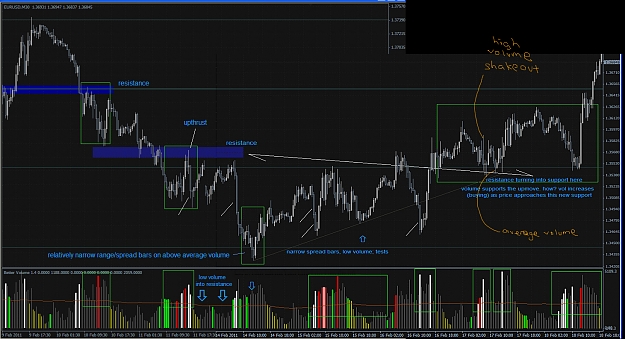
Thanks supremeChaos for your time and effort in explaining the chart. It seems i have overlooked some places where demand has stepped in. i have learnt frm your chart that low vol into resistence represent no selling interest and high volume into a ...
vsa with Malcolm
- Mtm replied Feb 20, 2011
question — Hi Dr G, I was studying through your explanations and also looking at my own chart at the same time. i have marked areas where i see weakness in black dotted lines and strength in orange dotted lines. I did not take any of the ...
vsa with Malcolm
- Posts by Member Search: 'Mtm'