- Search Energy EXCH
- 252 Results
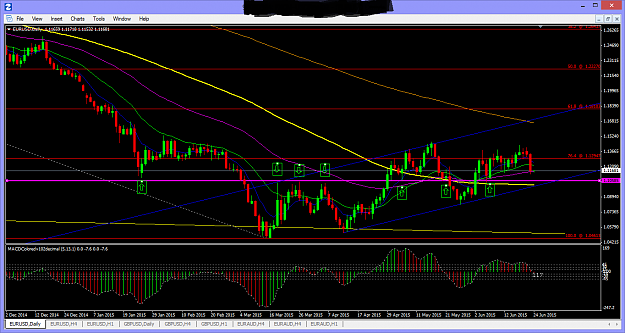
- Morelands replied Jun 23, 2015
Hey what's up Yvon Nice place for a turn around. Plus look at the purple horizontal line
4 Hour Strategy (MACD)
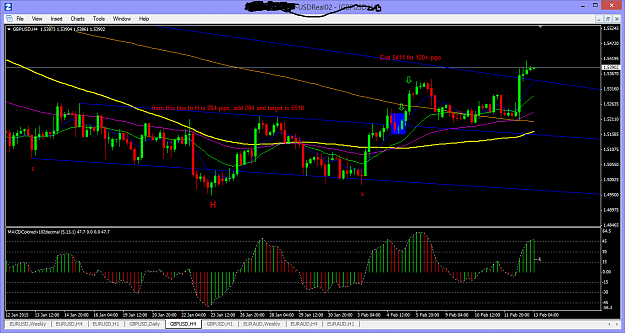
- Morelands replied Feb 12, 2015
Long time no post. Here is a trade I took. It's an inverse head and shoulders. I entered at the morning star indicated in the blue rectangle, also off the TL and with the 21 angling up pretty well. I took a 100+ pips off it. I have a couple of ...
4 Hour Strategy (MACD)
- Morelands replied Mar 27, 2014
Binnie, The missed opportunities never end, just get used to it and look for the next one. I took a trade on the EUR/AUD a few days ago and got 70+ pips out of it. However, .IF I had stayed in the trade it could have been a lot more. Here is the ...
4 Hour Strategy (MACD)
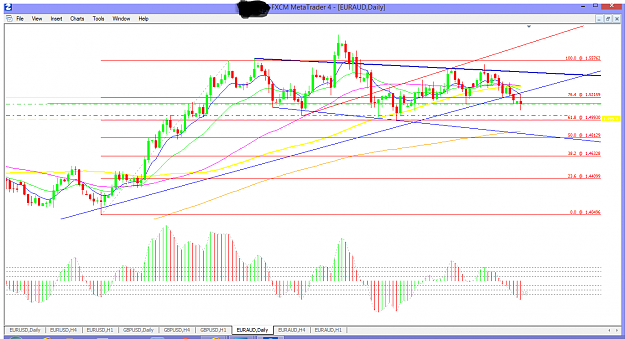
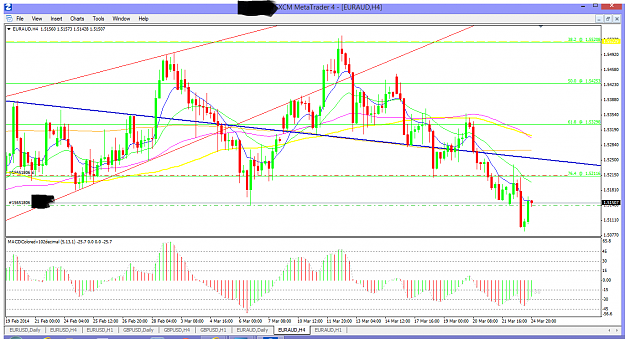
- Morelands replied Feb 25, 2014
Possible head and shoulder pattern on the EUR/AUD
4 Hour Strategy (MACD)
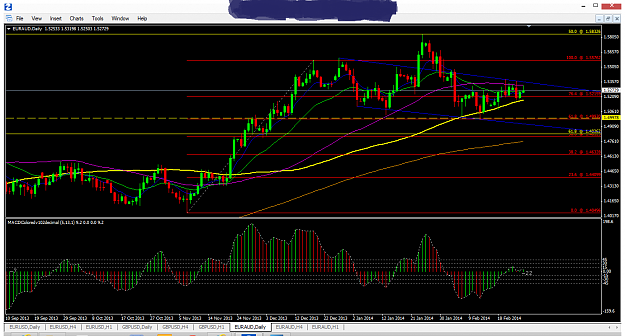
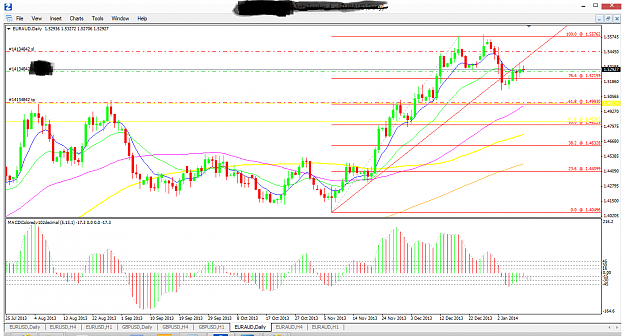
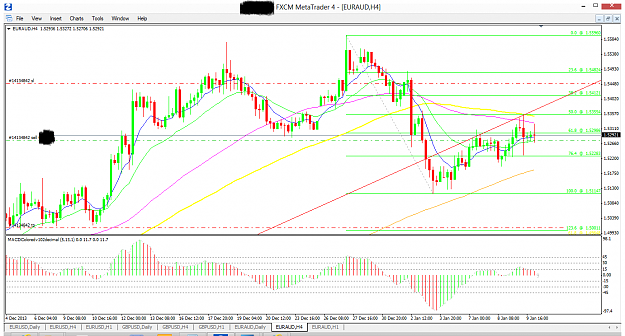
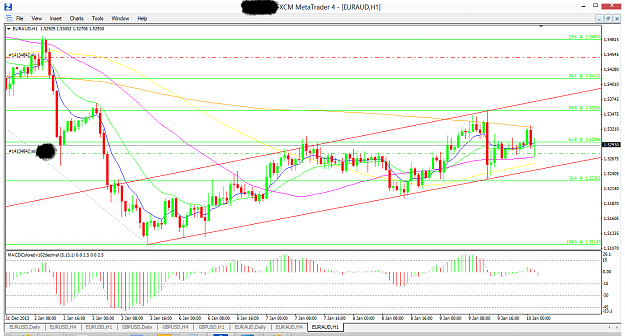
- Morelands replied Jan 13, 2014
Hello all. It's been a while. The 1st chart is the daily: It shows price breaking the support line and price breaking a lower low. The next chart is the 4 hr: It shows the fib from the move down. The 1 hr shows a little more: notice the bearing ...
4 Hour Strategy (MACD)
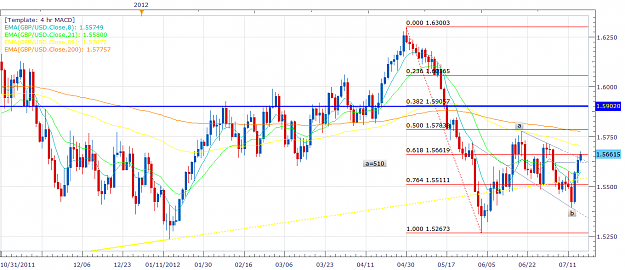
- Morelands replied Jul 16, 2012
Looking for short — Eur/usd looking good around 1.2620+ and GBP/usd at 1.5900
2012 Trading my Own Cycle
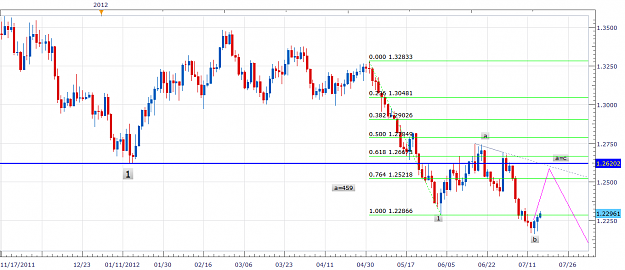
- Morelands replied Jun 30, 2012
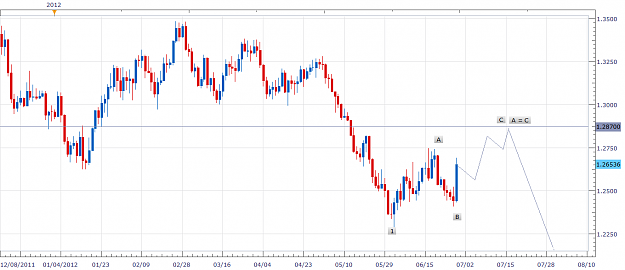
EU — Good to have you back! I thought you were gone for good. Here's a little picture of my expectations
2012 Trading my Own Cycle
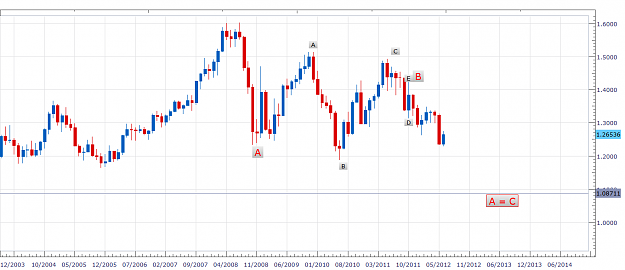
- Morelands replied Apr 18, 2012
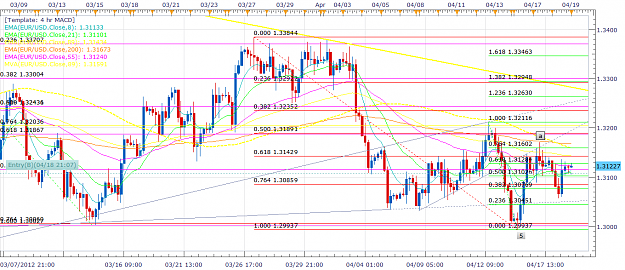
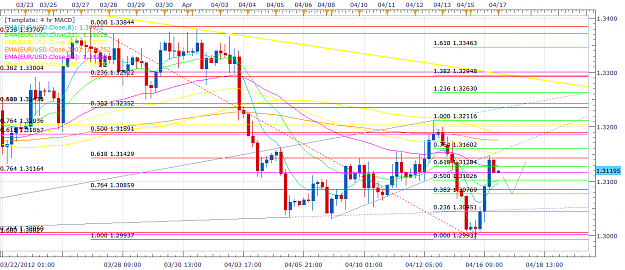
morning star — I believe we have seen the completion of the B wave with a morning star candle pattern. BTW, that is not an entry, just a pending order
Elliot wave, Harmonic And Ichimoku in CHINESE STYLE
- Morelands replied Apr 16, 2012
expectations — I've seen some posts and agree with the 5 waves down. I'm now looking for a pull back to the 38.2 or 23.6 (in green) to take a position long and retest the 1.3146 put in today. I'll take a position if I catch a candle pattern on ...
Elliot wave, Harmonic And Ichimoku in CHINESE STYLE
- Morelands replied Dec 6, 2011
Busy — You were a busy, lady? 2 trades in 1 day. I never took the trade. I was looking for price to really take off after it crossed that trend and it did not. (I've since erased that line) Since I did not do what I expected, I did not trade ...
4 Hour Strategy (MACD)
- Morelands replied Dec 5, 2011
Chart — Well, I'm at least a forgetful bastard. Here is the chart
4 Hour Strategy (MACD)
- Morelands replied Nov 21, 2011
possible set up — I'm expecting a break out of the descending triangle to the top. If it happens look for a pull back to the break out level and place your bets Edit: no trade
4 Hour Strategy (MACD)
- Morelands replied Oct 27, 2011
Trade — Here is a trade that I took last night. You can see by the blue rectangle (on the 4 hr chart) price was in a consolidation period. You can also see the hammer 2 candle before the one I entered that closed above the 21 MA (green). Price ...
4 Hour Strategy (MACD)
- Morelands replied Oct 19, 2011
trade — Here is a trade I took on Mon night. The 1st chart is the 4 hr chart showing the channel price. Notice how the 21 MA provided support in the channel. Once price broke out of the channel it crossed the 21 MA. Per Phillip's rules price ...
4 Hour Strategy (MACD)
- Morelands replied Sep 25, 2011
possible end of 5th wave — If you follow elliott wave this may be interesting. Measure the distance from point 0 (beginning of wave 1) to point 3 (end of wave 3). Take that distance and multiply it by .382. It equal 398. Subtract that from ...
EURUSD
- Morelands replied Sep 12, 2011
Long EUR — I'm long the EUR at 3645. TP at 3715 and SL is a close below 3618. My actual SL is well below there b/c I like to see how things play out. The main reason is the 100+ pip candle on the 1 hr forming a upside down sHS. This is a short ...
4 Hour Strategy (MACD)
- Morelands replied Sep 2, 2011
Missed trade — 1st chart is the daily with all the MA removed. Notice we are in a ranging market!!!!!!!!!. Notice how price is reversing around the 38 and 61 purple fibs. In a ranging market look for reversal signals...a evening star formation ...
4 Hour Strategy (MACD)
- Morelands replied Aug 27, 2011
Long — Looks like there are higher prices to come based on the daily candle. Look for consolidation, TC, and/or candle patterns
4 Hour Strategy (MACD)
- Morelands replied Aug 19, 2011
GBP trade — Here is my trade for the day. The 1st chart is the 4 hr. The blue rectangle shows resistance from previous price action. Also providing support is the trend line and the 21 MA (green). That is a lot of reasons to be long at that ...
4 Hour Strategy (MACD)
- Morelands replied Aug 17, 2011
GBP — Here is a possible set up on the GbP. Resistance becomes support? Look for a nice TC or candle formation. If it happens tonight I'll probably miss it. I've got to get some sleep. Raymond
4 Hour Strategy (MACD)