- Search Energy EXCH
- 66 Results
-
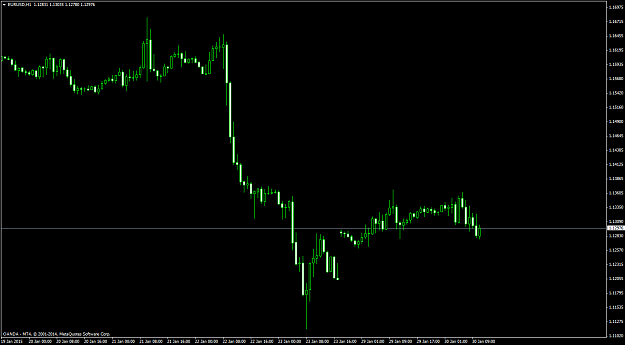
 Goodvalley replied Jan 28, 2015
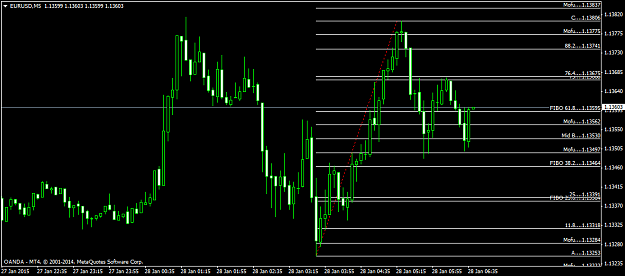
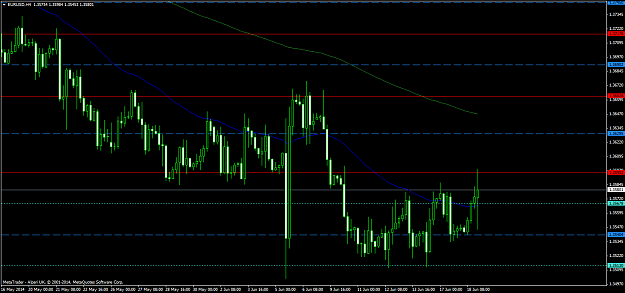
Had this one for 1.1333, 1.1288 & 1.1243. On the green and 1st TP, holding but still thinking we coud be buiding something bigger up... for the second big leg. Just pure speculation, of course...
EURUSD
- Goodvalley replied Jan 27, 2015
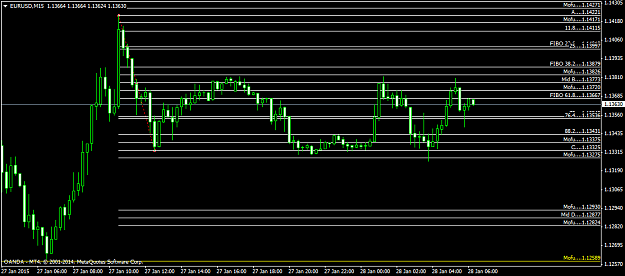
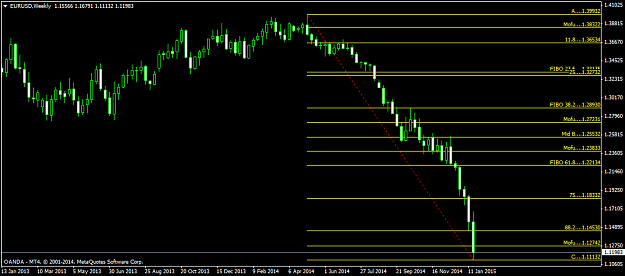
1.1422 TP achieved Txs G Hey Rock, this is what I got after downloading historical charts:
EURUSD
- Goodvalley replied Jan 25, 2015
Curiously enough, I've been waiting for weeks to see some alingment like the following one. I also saw the same as you before reading your post. One can "discover" unique alingments that "fit" what's in his imagination/will if he tries enough times ...
EURUSD
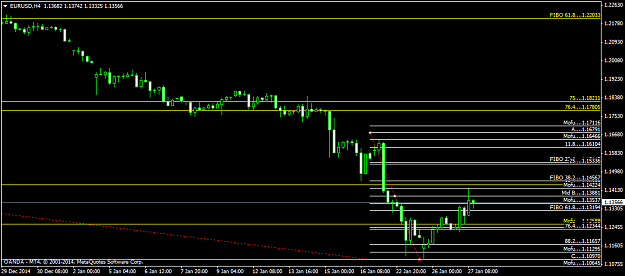
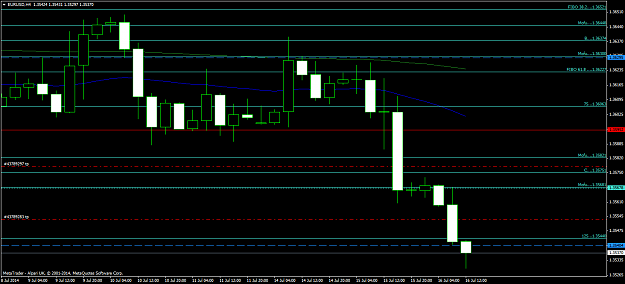
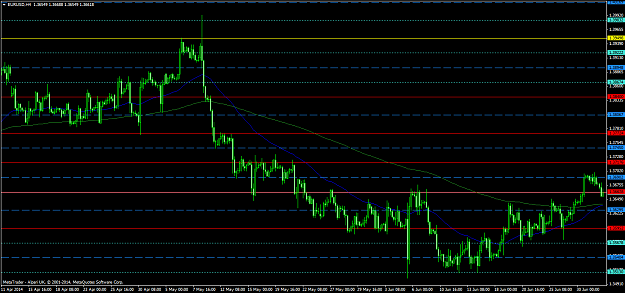
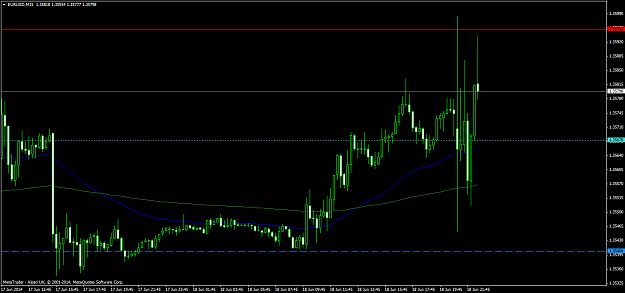
- Goodvalley replied Jul 17, 2014
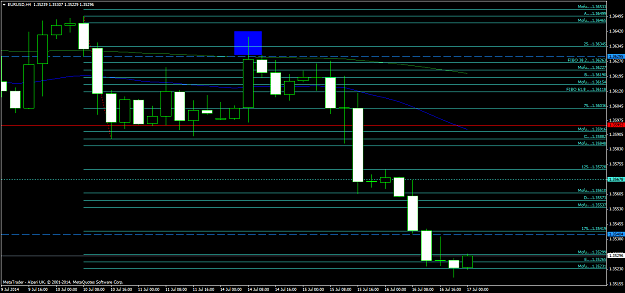
These are my levels, posted them weeks ago. From most to less important: yellow, red, blue and dotted clear blue lines. A 4H view shows their magic. image B/O of 1.3502 will be one thing, but trespassing the 1.3485 (yellow line) and getting ...
EURUSD
- Goodvalley replied Jul 16, 2014
Yes, I did see this, BUT since it retraced to 17.7% I simply took that as an invalidation of the setup. Since my idea is to stick with the tight stop + "most times" approach, when it comes back to more than 30.9% I tend to give up on the setup. The ...
EURUSD
- Goodvalley replied Jul 16, 2014
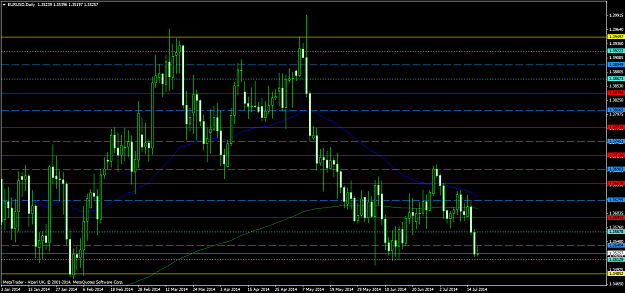
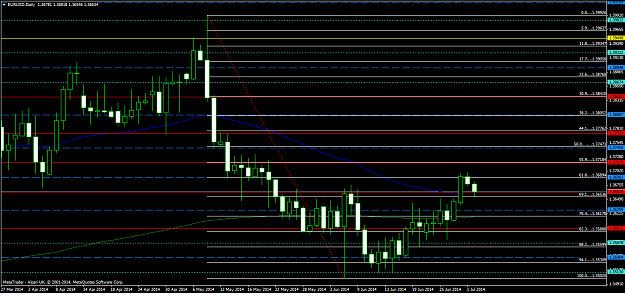
Levels shown weeks ago... Where does price stop?
EURUSD 3 levels without retrace, going for a 4th. My guess is this may retrace at least 1 or 2 levels from around 1.3513, if not more. Maybe 1.3502-ish. image If one had followed the downward setup ...
- Goodvalley replied Jul 11, 2014
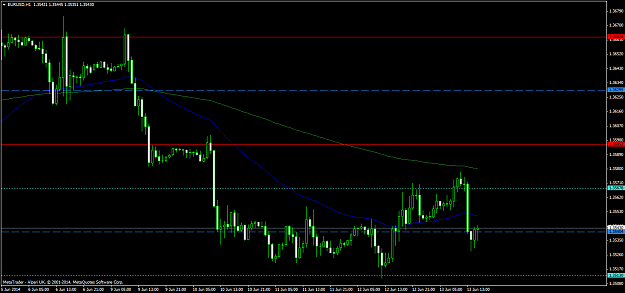
Yet another lesson from you today... Had these same numbers/lines since few days ago. I did try on July 4th, s/o at 1.35800, tight S/L at BE Then again July 7th, tight S/L (3 pips), now of course at BE Both trades shown in the charts (blue lines) ...
EURUSD
- Goodvalley replied Jul 2, 2014
Hey MaxDoom, I think we are saying the same with different words?
EURUSD That's why I said having a retrace OF 61.8 equals a retrace TO the 38.2 point. So in your A to B example, a retrace of 25% to the 75% point, right? But in reality I showed ...
- Goodvalley replied Jul 2, 2014
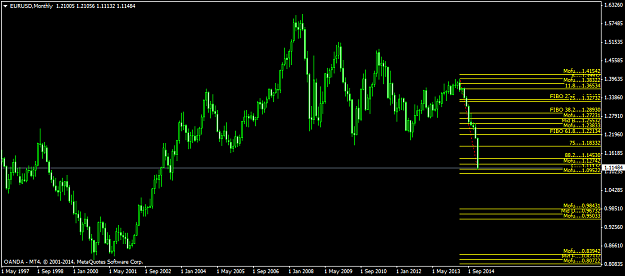
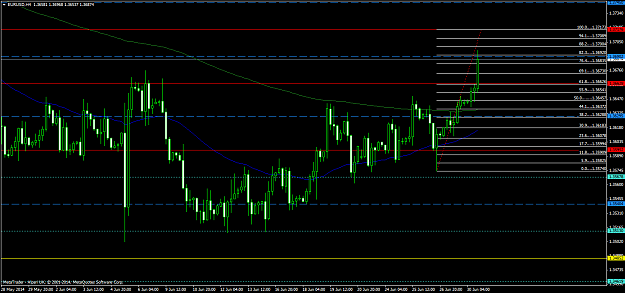
To me, stars would be aligned if/when arrived at 1.3805 (it doesn't mean I really expect to get there):
EURUSD
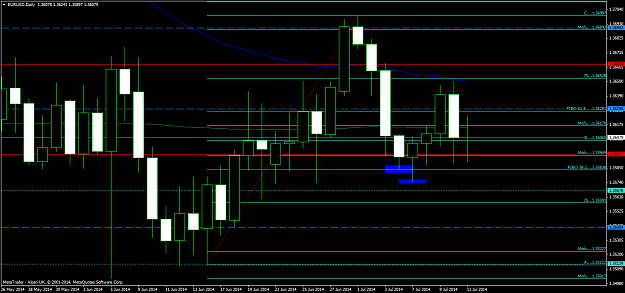
- Goodvalley replied Jun 30, 2014
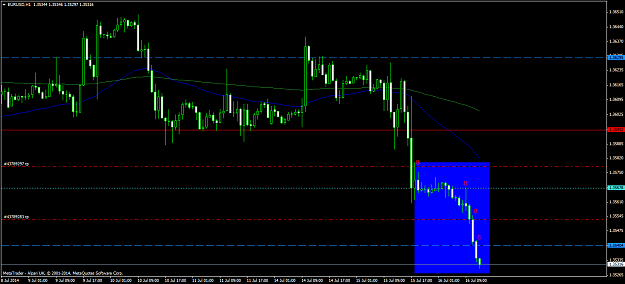
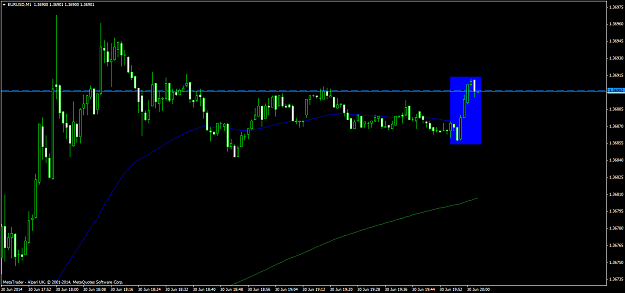
Forgot to show the sudden rise for the last 5 minutes of last 4H candle to make it close above certain specific level. My levels were drawn weeks before, as shown many times. It seemed to be flat or declining, but it suddenly went up for the 4-hour ...
EURUSD
- Goodvalley replied Jun 30, 2014
In the last 5 minutes of the 4H candle, price has been suddenly risen to match certain level when closing the 4H candle. It "should" mean continuation to at least 1.3717, see chart below. Now, this would be four levels in this chart with no retrace. ...
EURUSD
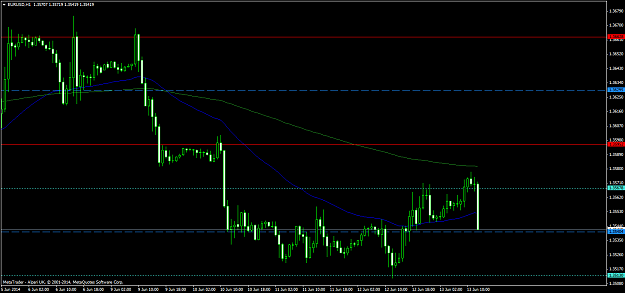
- Goodvalley replied Jun 13, 2014
That's what I meant when I said 1.3540 level would act as a rebound spot. I was hoping a HL, but then I thought it wouldn't hold.
EURUSD
- Goodvalley replied Jun 13, 2014
Ok, let's see if 1.3540 level is able to rebound this thing up...
EURUSD