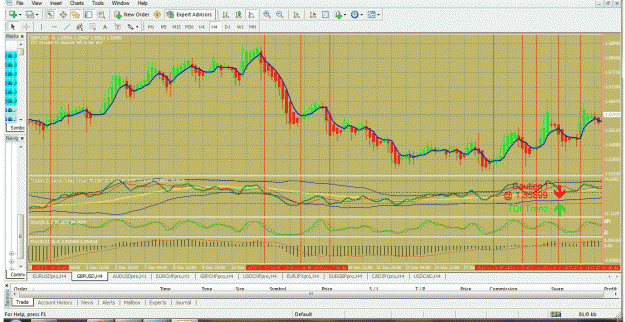
Another my chart. Please explain me why from 2010.12.17 till 2010.12.29 TDI so ranging? For me It looks like down trend from 2010.12.14 continues image
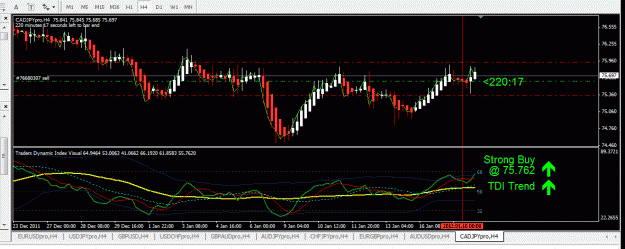
This is one of my try. As i noticed after all it was wrong entry because of weak TDI angle and to small candles. Maybe you see more signs what was wrong? image