- Search Energy EXCH
- 80 Results
- Elios replied Apr 11, 2017
Hello Nojak There is a monthly SZ there and I think that these wicks are part of this monthly SZ.
Trading Institutional Order Flow
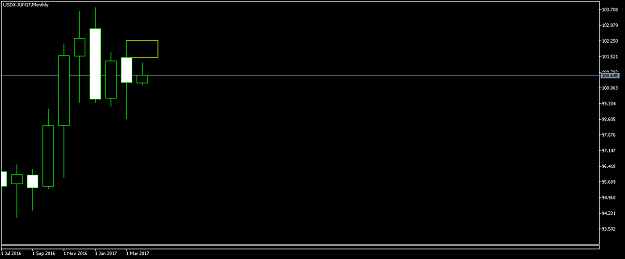
- Elios replied Apr 9, 2017
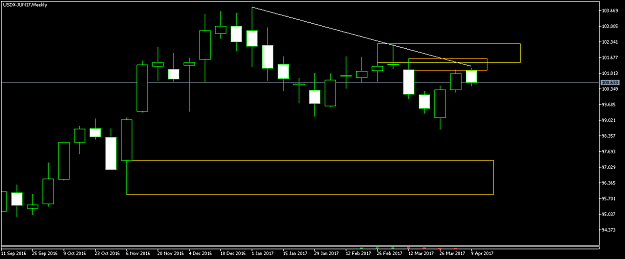
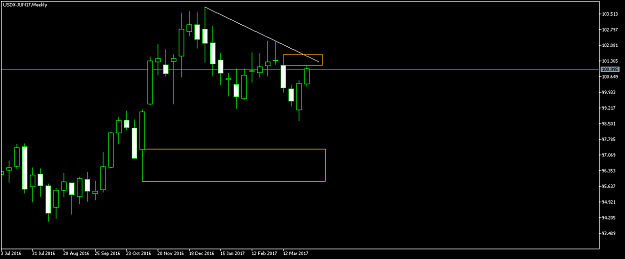
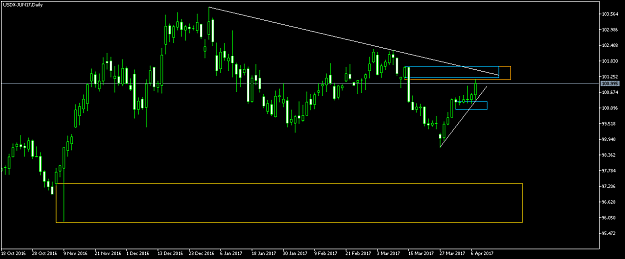
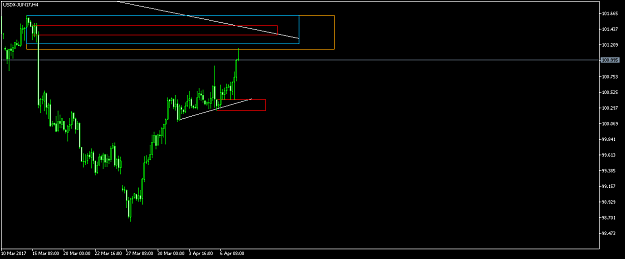
The USD index is reaching an area with nested Supply zones and the uptrend is possible to reverse. So the EU,GU,AU and NU is possible to go up and the UJ and UC is possible to to go down.
Trading Institutional Order Flow
- Elios replied Mar 25, 2017
hello 4rXal-ghul No I dont change the SAD method. The trendlines are for estimating momentum. A channell is composed of two trendlines. The one is a momentum trendline by the SAD method. The other is a parallel trendline. For example, you can see on ...
Trading Institutional Order Flow
- Elios replied Mar 24, 2017
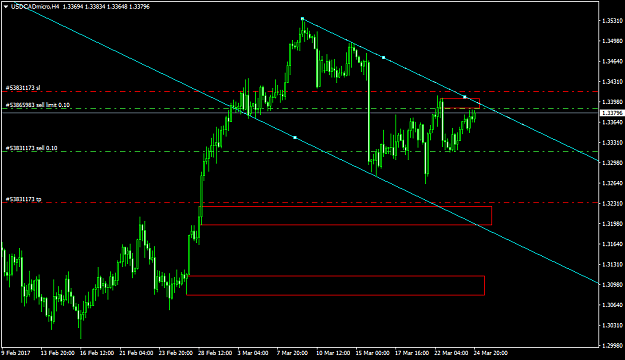
Hello everyone Sometimes instead of trendlines I use the equidistant channel. It shows me where the price will stop, either for entry ot for TP
Trading Institutional Order Flow
- Elios replied Mar 21, 2017
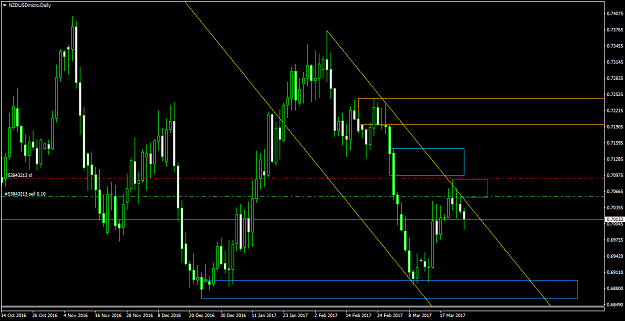
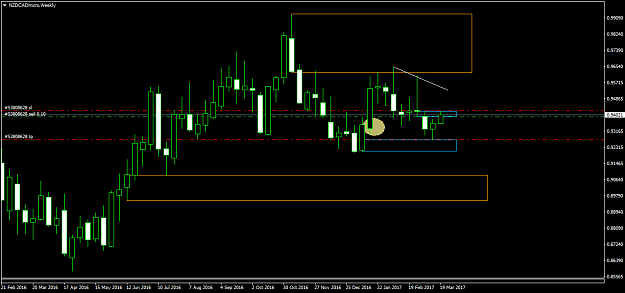
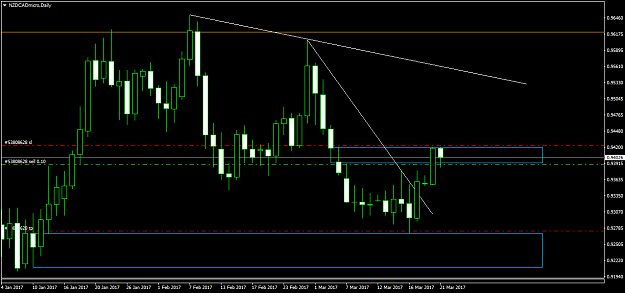
NZD/CAD Curve and Trend timeframe (weekly / orange color) : The trend is down (a DZ removed + the ability to draw a momentum trendline). The price location is in the midle of the curve. Execution timeframe (daily / blue color): Bearish sideways ...
Trading Institutional Order Flow
- Elios replied Mar 17, 2017
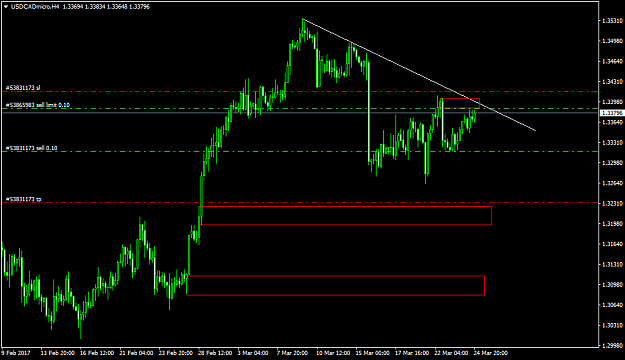
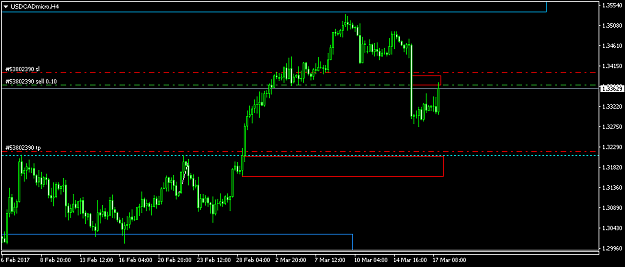
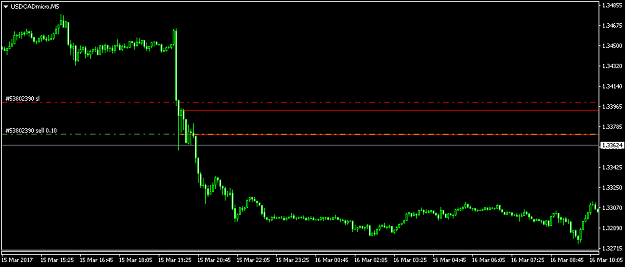
USD/CAD re - entry following the trend, after the retracement into a M5 SZ. Target : a H4 DZ where there is a support line
Trading Institutional Order Flow
- Elios replied Mar 15, 2017
I closed this trade... I will re-enter later.
Trading Institutional Order Flow
- Elios replied Mar 14, 2017
Hi bleeze, we are in the same trade... do you have a target?
Trading Institutional Order Flow
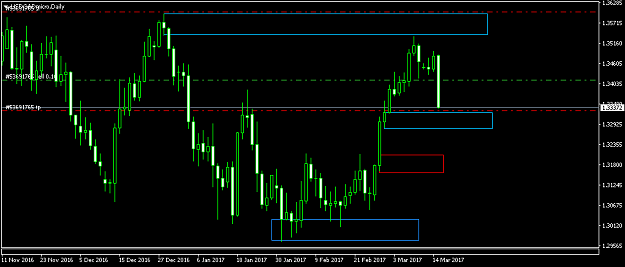
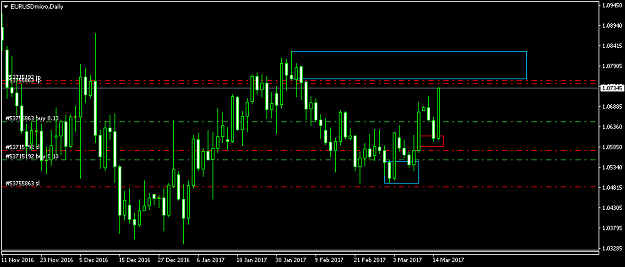
- Elios replied Mar 14, 2017
EUR/USD UPDATE : I added another buy order after the retracemnt into a 4H DZ.
Trading Institutional Order Flow
- Elios replied Mar 12, 2017
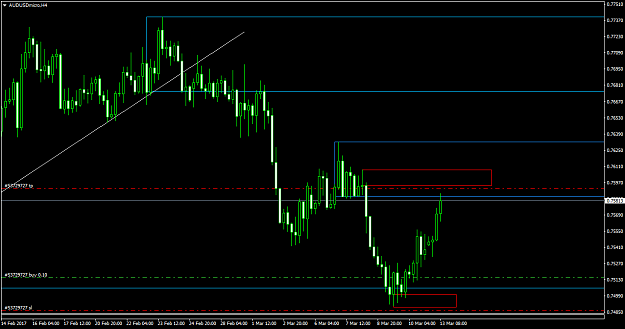
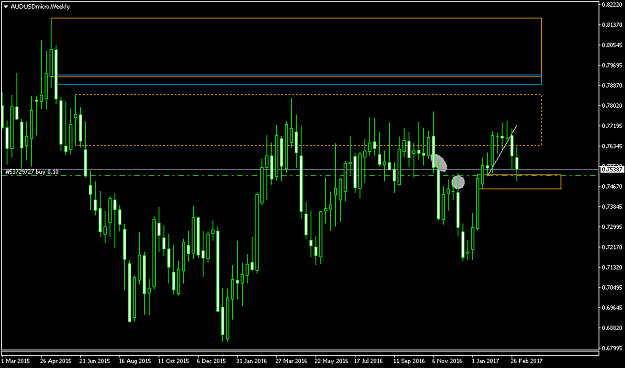
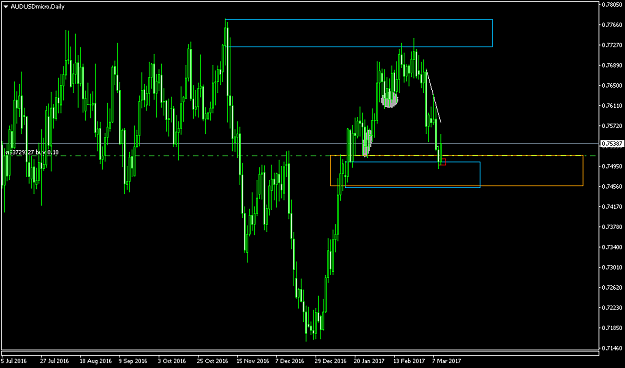
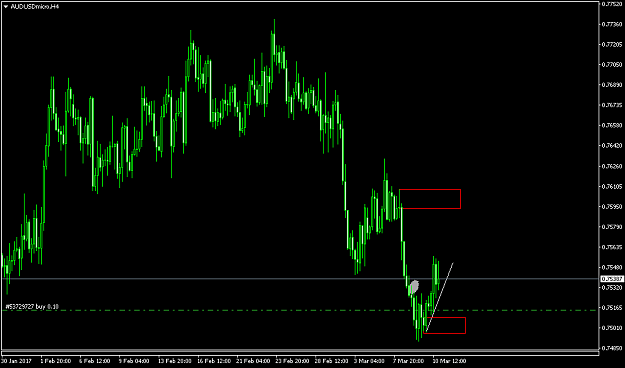
AUD /USD : A pullback Curve timeframe (weekly / orange color) : The trend is bullish sideways trend. The upside trendline has been broken. The SZ with dotted line is not fresh, so we choose the higher fresh zone. Under this weekly SZ there is a ...
Trading Institutional Order Flow
- Elios replied Mar 9, 2017
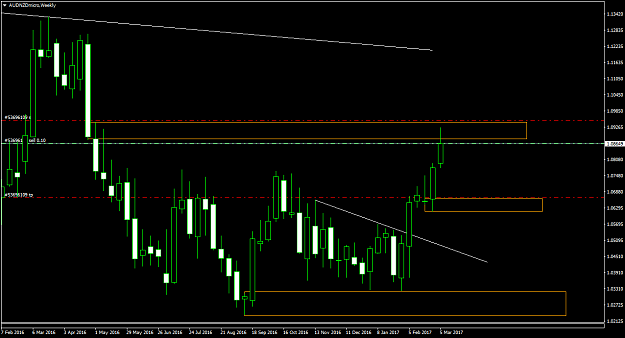
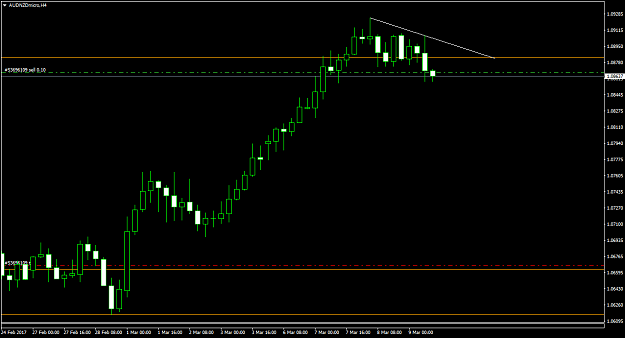
AUD/NZD Daily trend is UP Weekly is a bearish sideways trend. Monthly trends is down. The Daily trend is out of alignment. It can only be stopped by the Weekly supply zone which is also a Monthly SZ. On the 4H chart a downside trend line has been ...
Trading Institutional Order Flow
- Elios replied Mar 8, 2017
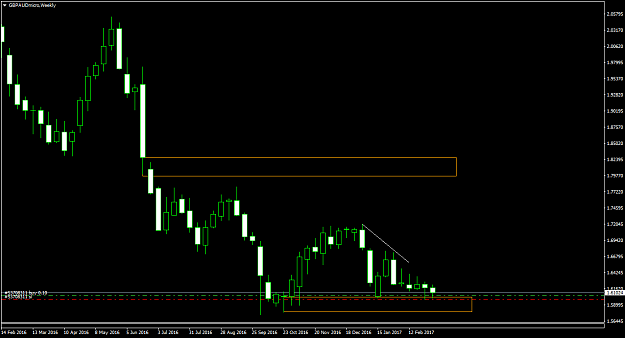
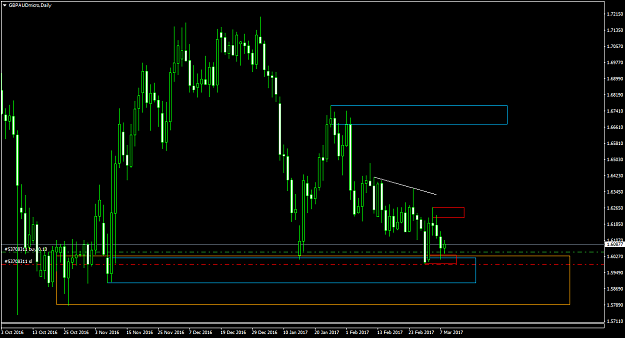
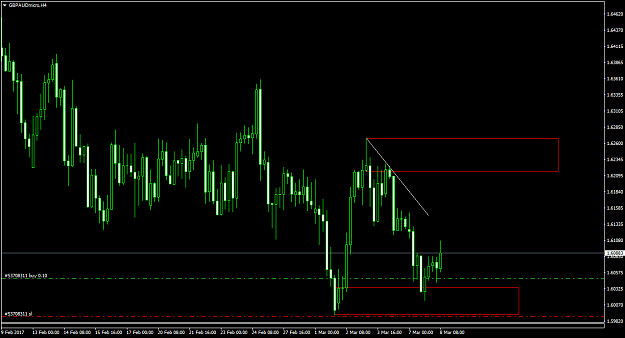
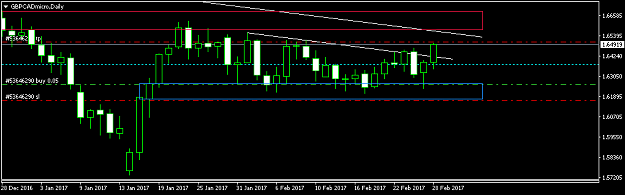
GBP/AUD A trend reversal? Weekly, daily and 4H trend is down. As SAD traders, we have to "ANTICIPATE" the new trend compared to the traditional trend trader who is taught to "FOLLOW" the old trend (a quote from Akt). On the daily chart we can see ...
Trading Institutional Order Flow
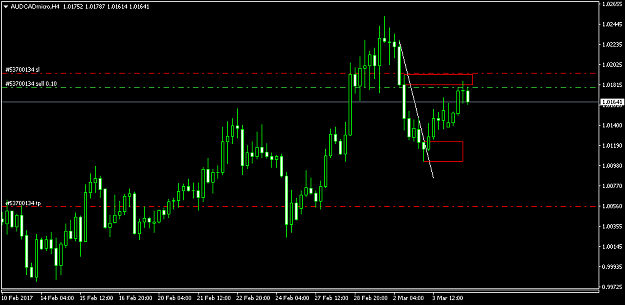
- Elios replied Mar 6, 2017
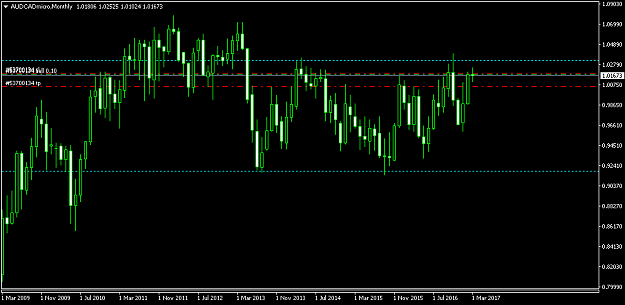
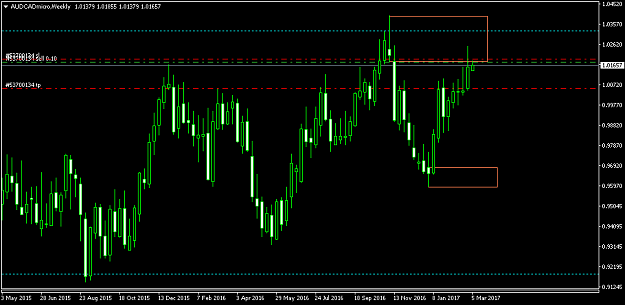
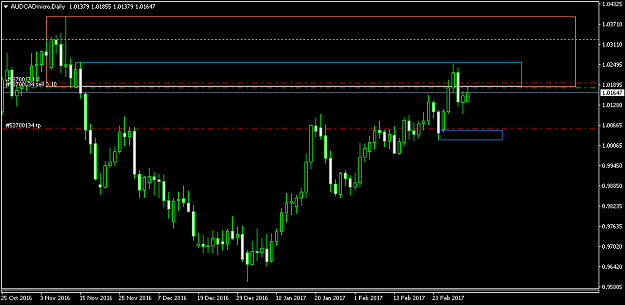
AUD /CAD We can see on the Monthly chart that the price is in a range and has reached the upper zone of the range. From the weekly and daily charts we can see that there are embeded supply zones, which means that the weekly and daily sellers are in ...
Trading Institutional Order Flow
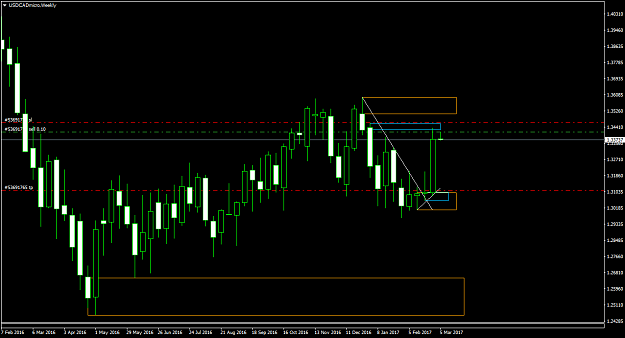
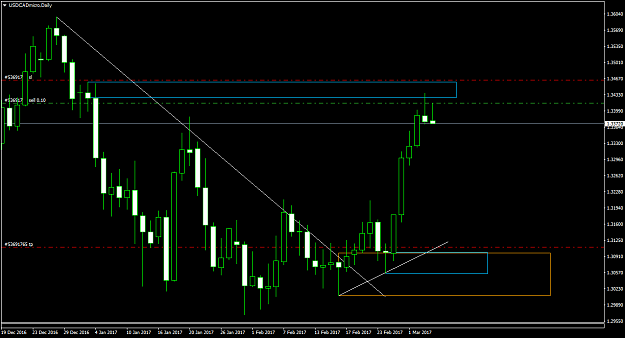
- Elios replied Mar 6, 2017
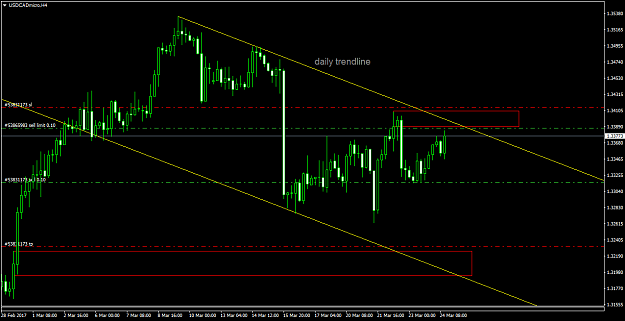
Good morning everyone. USD/CAD Trend timeframe (weekly / orange color) ) : Bearish sideways trend. The momentum trendline has been broken and a fresh demand zone has formatted. Execution timeframe (daily / blue color): Up trend
Trading Institutional Order Flow
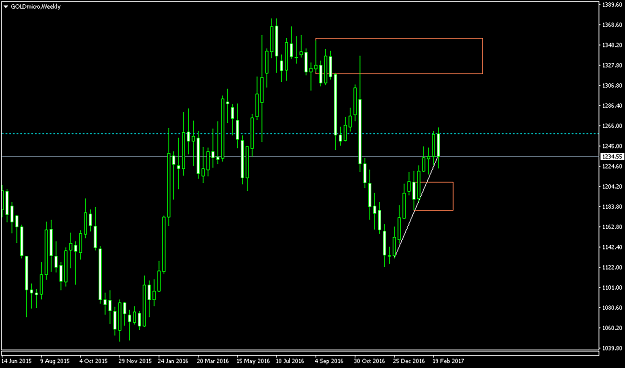
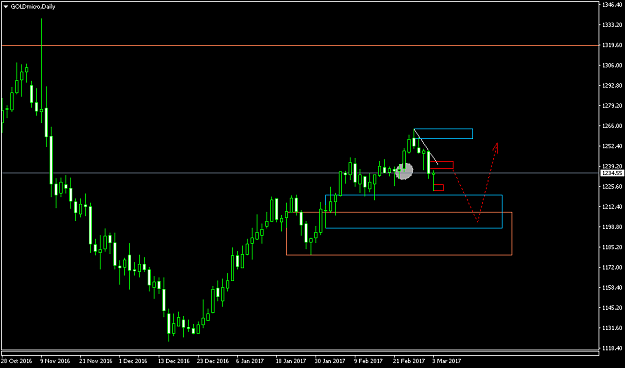
- Elios replied Mar 5, 2017
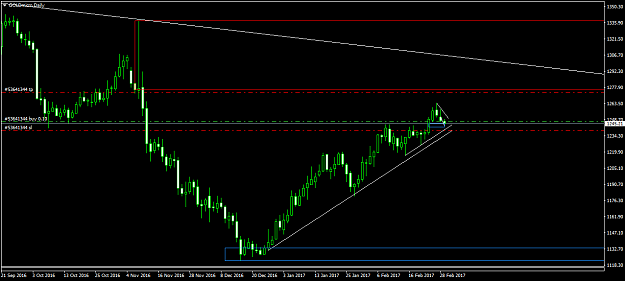
Gold A pullback In my last post I took a rushed trade in Gold, without doing the multitimeframe analysis, which is valuable. So I have to correct my mistake. Curve timeframe (weekly / orange color) : The trend is up. The upside trendline is about to ...
Trading Institutional Order Flow
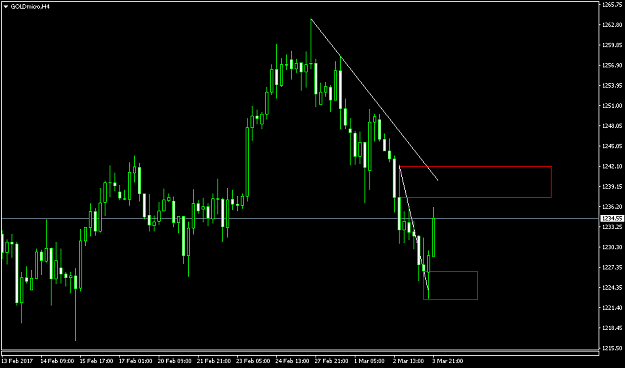
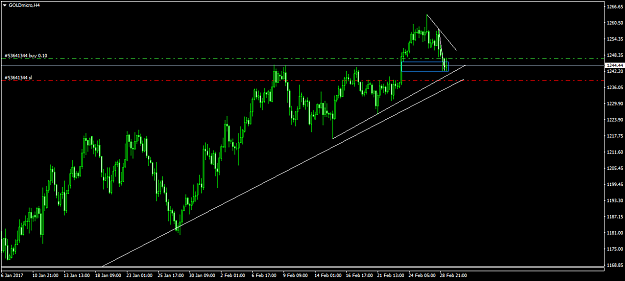
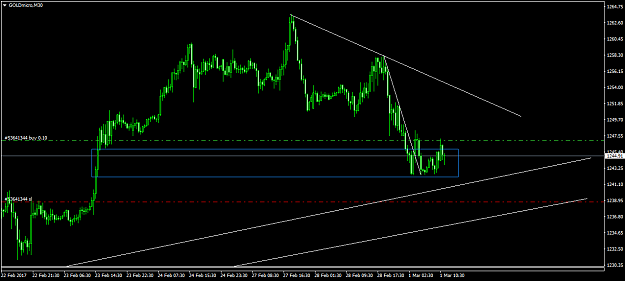
- Elios replied Mar 1, 2017
Gold chart 1 : The weekly and daily trends are UP, the 4H trend is Down chart 2 : Entry from M30 after the momentum trendline break chart 3 : Target the daily SZ (R:R = 1:5) Edit : Initially, for safety, I put the SL under the daily momentum ...
Trading Institutional Order Flow
- Elios replied Feb 28, 2017
Thank you for your comment. This trade was a great success because the target reached very quickly...but if I had drawn correctly the daily demand zone ... I would' nt have taken the trade, due to the big SL.
Trading Institutional Order Flow
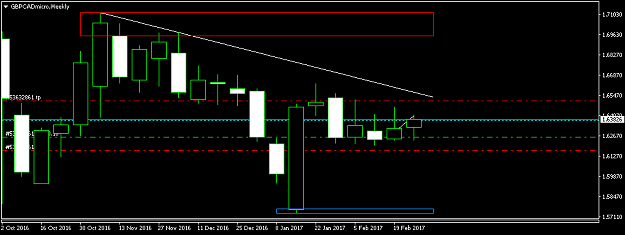
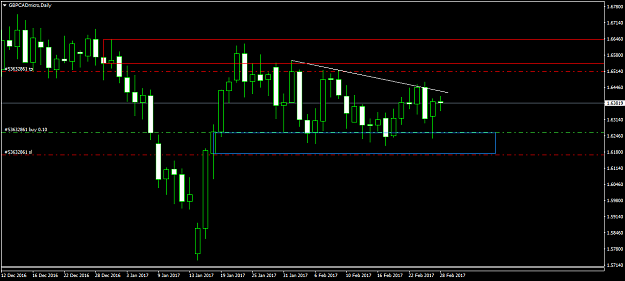
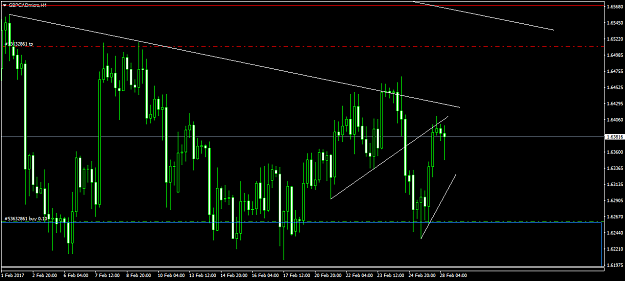
- Elios replied Feb 28, 2017
A risky counter trend trade On the weekly and daily chart we can see that the trend is down (a DZ removed + the ability to draw a momentum trendline). On the weekly chart we can see the horizontal line which is at the middle point between the ...
Trading Institutional Order Flow