- Search Energy EXCH
- 36 Results
-
 DrLobo replied Feb 22, 2011
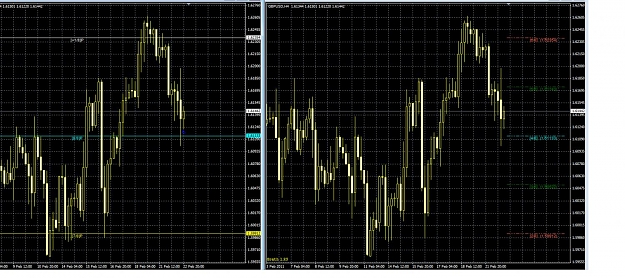
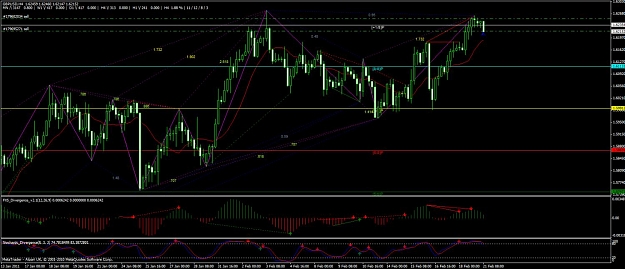
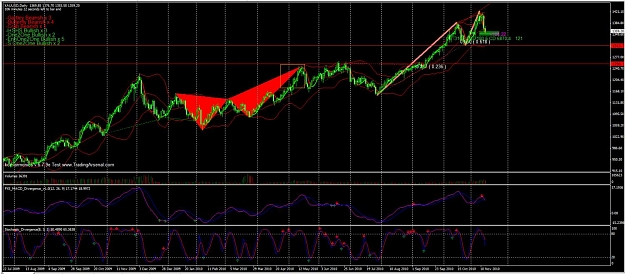
The Problem With Murrey Indicators — Here you see, 2 different Murrey Indicators, on the same pair and on the same time frame. Result = Different Murrey Lines drawn are drawn depending on what indicator you are using. One of the indicators is ...
Trading using Murray Maths and Price Action
- DrLobo replied Feb 21, 2011
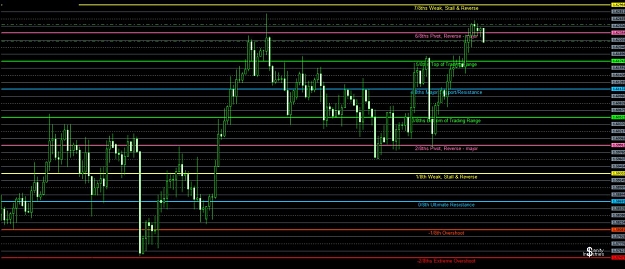
EurYen — Does this pair respect for MML levels ??? This huge spike hit my stop.
Trading using Murray Maths and Price Action
- DrLobo replied Feb 21, 2011
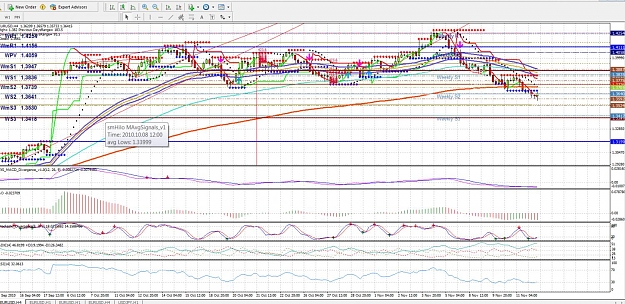
GU Trade ? — ok lets get back to theory. So according MML theory is this just a simple sell ?? Wait and see what happens trade ? Is MML saying 95% chance of this going back to 8/8 level ? (thats 94 pips) Sounds too good to be true, so there ...
Trading using Murray Maths and Price Action
- DrLobo replied Feb 21, 2011
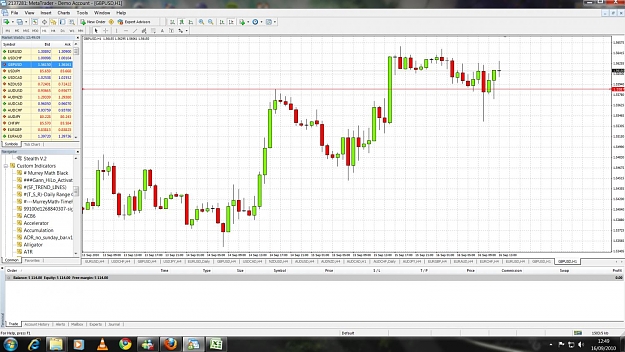
which indicator to use ? — Hi Murrey People ! So I am testing on demo accounts for a few days and I have realised that there are quite a few Murrey Maths Lines indicators out there for MT4 which actually produce different values ! What do I ...
Trading using Murray Maths and Price Action
- DrLobo replied Nov 17, 2010
reasons to short` — 1) 15M HMA turned red 2) Stochastics crossover 3) MACD crossover soon 4) 3535 crossed. Short @ 3533 TP 1: 3500 (61% retracement) SL: 3550
EURUSD
- DrLobo replied Nov 15, 2010
I have seen your calls on gold, I am interested in some action here aswel, but I need to see confirmation in PA. If gold falls for another day, and if PA goes past the green support box then it will invalidate this gartley shape and will fall ...
EURUSD
- DrLobo replied Nov 12, 2010
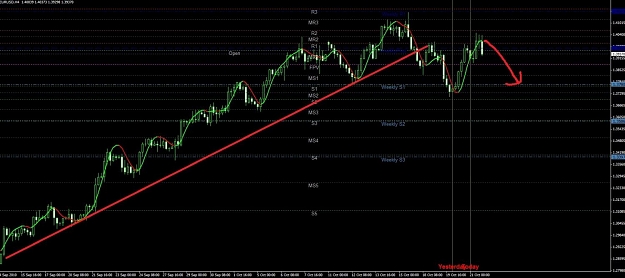
Must hold at leas 3760 !! — Must hold at leas 3760 !! and then hopefully then next move down we can crack the 200 MA and the support line.
EURUSD
- DrLobo replied Nov 12, 2010
4hr broken 200MA setup — well ok I waited a couple of months for this one. Its based on the 4 hour chart, if you have a look historically what happens when PA breaks through the 200 MA ... in general it means next couple of months will move in ...
EURUSD
- DrLobo replied Oct 26, 2010
HMA indicator — I am long, SL: 3830 or HMA indicator turns red TP: 3900 I am using HMA indicator to predict movement on 1hr chart, when line turns red means go short and when line goes green means go long. We just started with a green line so ...
EURUSD
- DrLobo replied Oct 21, 2010
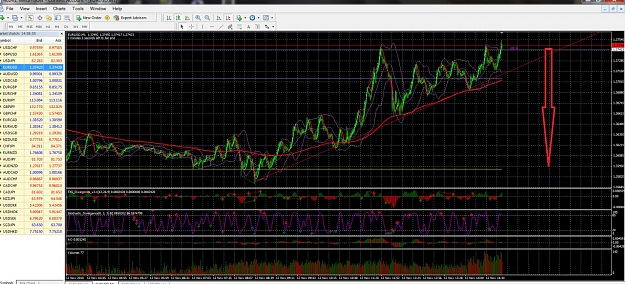
Probably whats not going to happen — but this is what I am betting on. As you can see on 4hr chart the up trend is broken, and now the last bar 4hr bear, is setting the path for route 1.3780. Well to me its logical, but knowing my luck its ...
EURUSD
- DrLobo replied Sep 21, 2010
my tech analysis says we are gonna go down, but supertrend is saying to go long. lets see how it plays out.
Multiple Trading systems gbpusd only
- DrLobo replied Sep 21, 2010
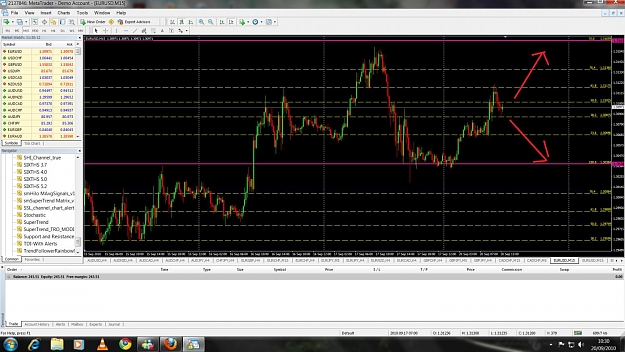
2 lines — Hi, Could you please correct me if I have done something wrong. Was there a valid sell signal here because price closed under 15519 a total of 4 times in the 1 hour chart, or have I misinterpretted the rules ? Thanks
Multiple Trading systems gbpusd only
- DrLobo replied Sep 20, 2010
are we supposed to go to 1.31659 or to 1.30384 ? Thanks
Aboonacci System - for EUR/USD prediction
- DrLobo replied Sep 19, 2010
do I understand this correctly — Sorry I have just recently started reading about this strategy. To see if understand correctly, if we see a break and close below 1.3038 ... then should we eventually see 1.2911 ? Or I am being too simplistic ?
Aboonacci System - for EUR/USD prediction
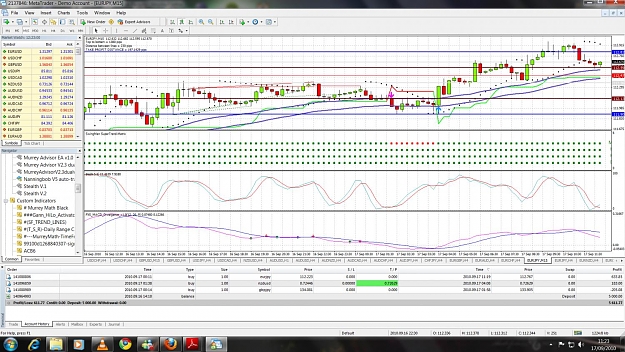
- DrLobo replied Sep 17, 2010
my supertrend indicator on EU says long on the 15 min. I got over 50 pips.
Multiple Trading systems gbpusd only
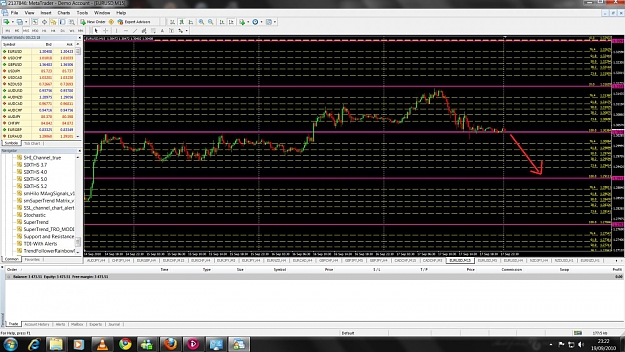
- DrLobo replied Sep 16, 2010
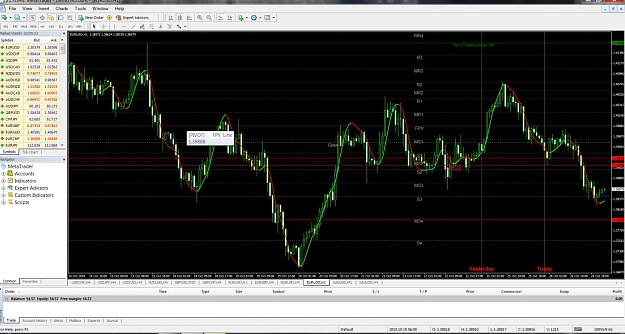
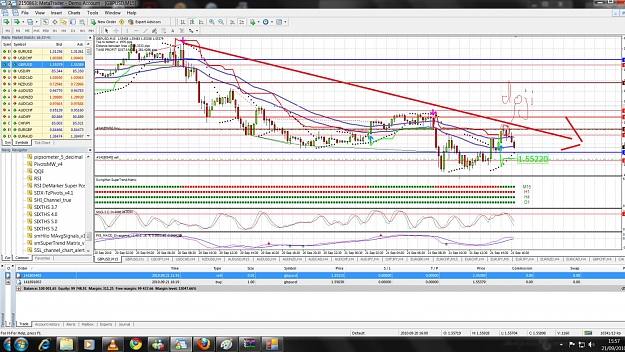
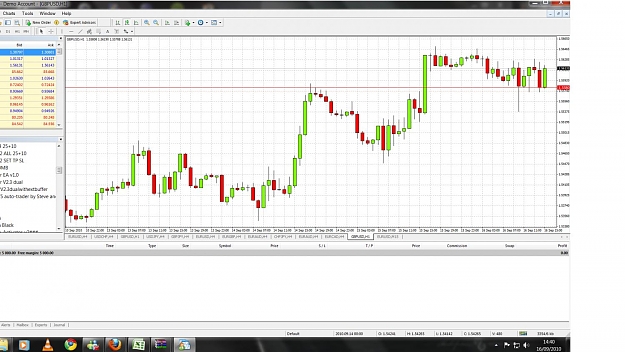
as you can see my eur/usd is hold. On this chart, what do i have to manually measure to see if it satisfies the distance ? is it the close of the previous bar (green hammer) with the blue line or with the red line ? Anyway results are Blue line = 16 ...
Murrey Advisor by MoStAsHaR15
- DrLobo replied Sep 16, 2010
guys something wrong with my system here and i did not get this long call on usd/jpy. I am using version 2.3. I also tried strategy test on the EA advisor 1 and did not get a single trade opportunity in the last month.
Murrey Advisor by MoStAsHaR15
- DrLobo replied Sep 16, 2010
thanks everyone, i am just using demo account for now untill i get comfortable with the system. Looks like big battle at the 5580 i will short this when it closes under.
Multiple Trading systems gbpusd only
- DrLobo replied Sep 16, 2010
Hi, I am new to these systems here so forgive my ignorance feel free to flame me if i get it wrong. I am looking at the "2 lines" system. The number for today are: "GU- 15650 upper 15587" According to my chart we closed on the hour chart twice below ...
Multiple Trading systems gbpusd only