- Search Energy EXCH
- 21 Results
-
 Dezil replied Nov 5, 2021
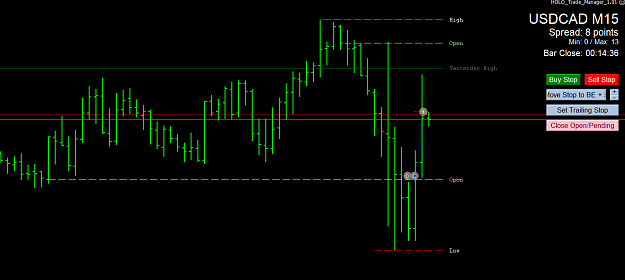
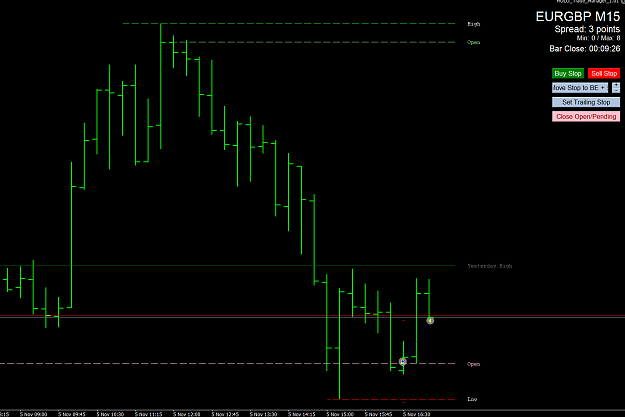
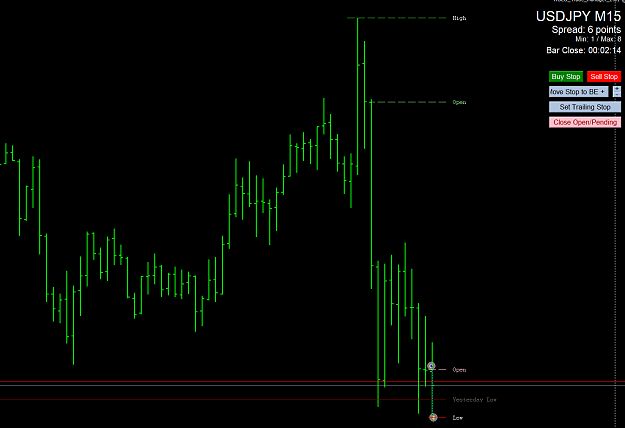
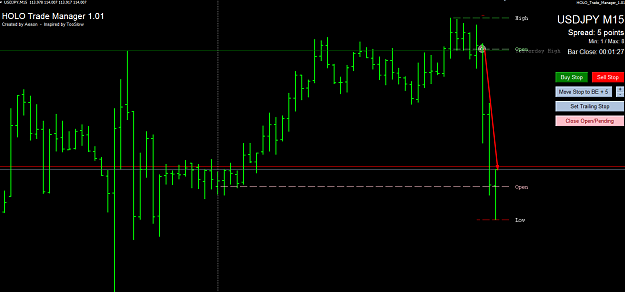
+10 USD/CAD But RR was not very good because of wide daily low / lower open zone. +5 EUR/GBP LOSS USD/JPY
Highest Open / Lowest Open Trade
- Dezil replied Nov 4, 2021
+22, but a bit risky because of prev day high
Highest Open / Lowest Open Trade
- Dezil replied Jul 7, 2017
I think we missunderstood each other. 1.2 means 12 I think image
scalping template tma
- Dezil replied Feb 9, 2017
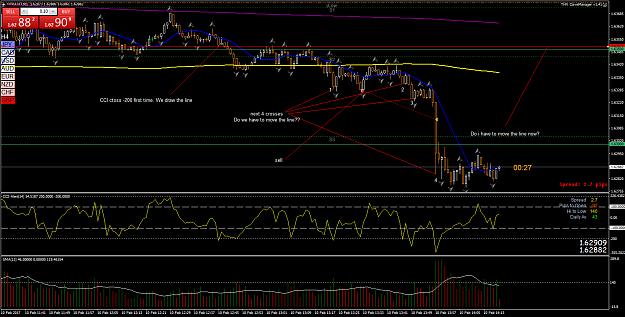
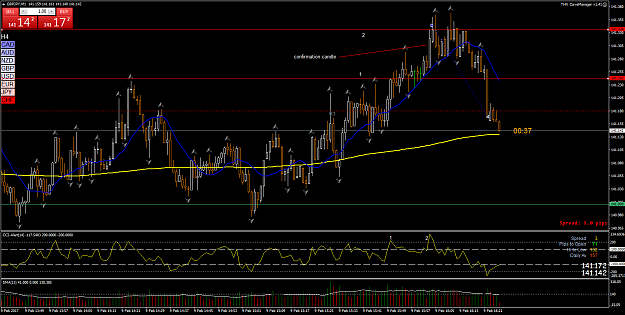
Second loss for the day. This is the example of what i was asking about. We have cci cross 200 #1 and confirmation candle, but during this confirmation candle cci makes new 200 cross (#2). Do i have to forget about current setup and move line to the ...
Scalping trading system CCI based
- Dezil replied Feb 8, 2017
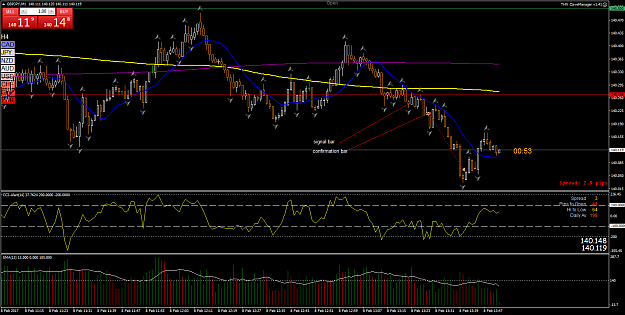
I dont know if this was the right sequence, but TP hit. Maybe i should't have wait for the entry for such a long time after first cci -200 cross, but there was no opposite signal (cci +200) so i was waiting. image
Scalping trading system CCI based
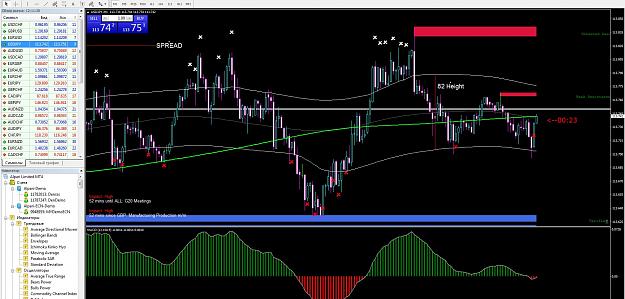
- Dezil replied Feb 8, 2017
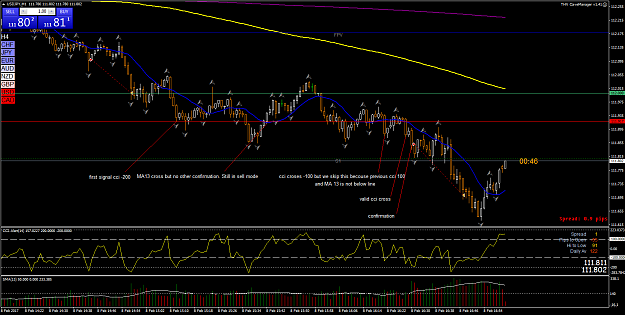
Some example from todays EURUSD. 1. cci cross -200 (start to search for the short entry) 2. SMA13 crosses down the low line of bar from point 1 ( start to wait for cci cross -100 or some other confirmation) 3. fractal break pattern and cci cross ...
Scalping trading system CCI based
- Dezil replied May 16, 2015
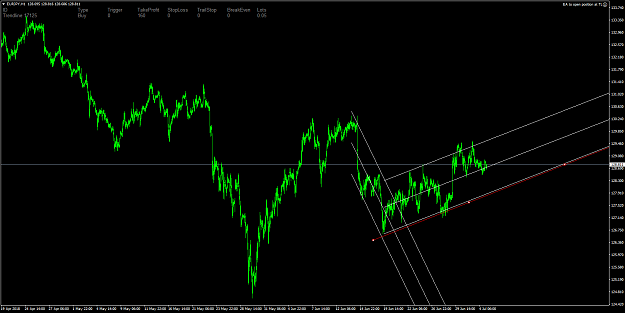
Yes it works from Jan 2015 but here is the test with your additional rule from 2008 image
Daily green/red candle
- Dezil replied Jun 20, 2013
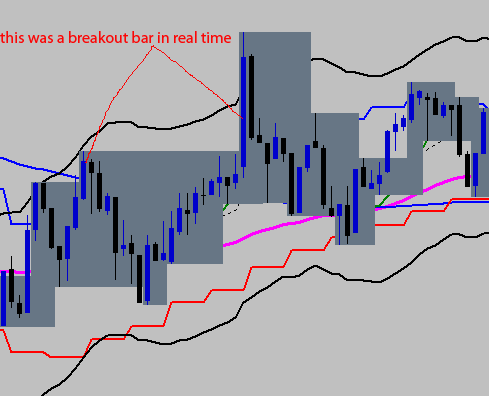
I whant to warn you that this indicator with grey areas is based on fractals and so it repaints last 2 bars. So be careful in visual back tests. Here is one example:
Daytrading/scalping with high leverage - my proven strategy
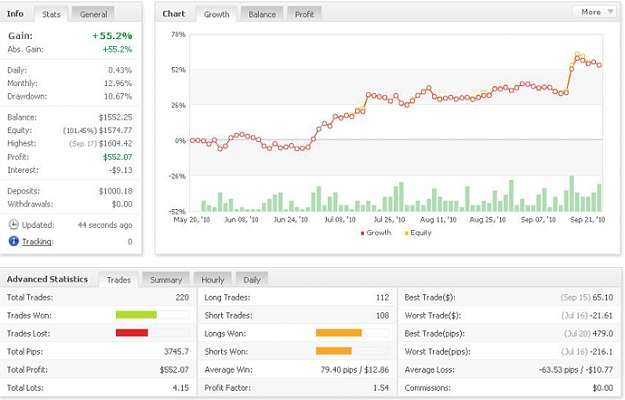
- Dezil replied Sep 24, 2010
Hi, Mikkom! Just to have more fun - here are my results from real account. 8 algos on 3 pairs.
Systematic trading
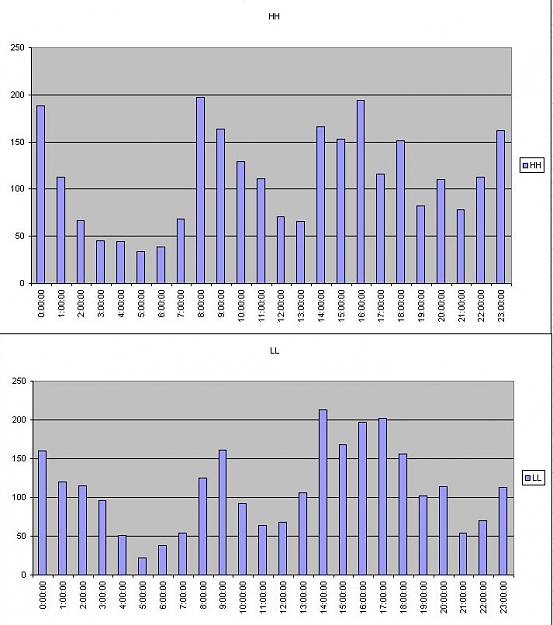
- Dezil replied Nov 19, 2009
HH LL — Here is my charts for HH and LL hour of each day EURUSD. Charts are calculated for 2661 days of history. Time is gmt+1 alpari demo data. As you cann see there is some difference in distribution with Mokkim's charts. But maybe Mikkom ...
Systematic trading
- Dezil replied Jul 21, 2009
ATR — Here is my latest experiments with price action and ATR during each day. Each lines shows certain fibo level of daily (5 days) ATR. When price touch the line it means that price make for ex 0.618 of 5 day ATR.
Systematic trading
- Dezil replied May 2, 2009
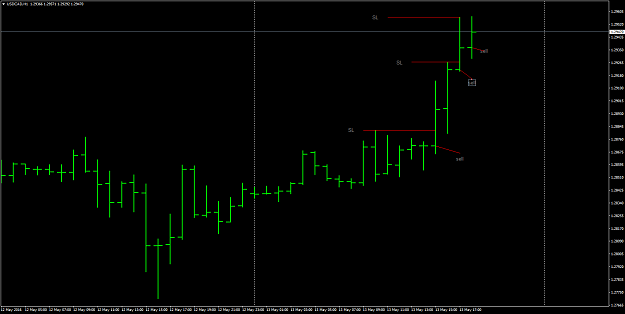
Will it be right SL at this short trade? SL=C+(B-A)/2
Mikkom's stophunter system
- Dezil replied May 2, 2009
First question. Look at the picture. As you see last low fractal is higher then last high fractal. Will you take this trade (set sellstop order) and what stop loss will be in this case?
Mikkom's stophunter system
- Dezil replied Feb 12, 2009
Look at this example. Arrows is your indy and dots is my norepaint version. 5/8 ma cross GBP/USD Do you see the difference?
Simplest Daily EMA Cross System

- Dezil replied Mar 22, 2008
Hi to ALL 2 more indy from me. I think they may be useful. Its Guppy but looks like histogram. One for single timeframe and one multitimeframe. So we can always see Guppy direction on current timeframe or any other without switching screen. Below is ...
Trend Follower 5 Minute System