- Search Energy EXCH
- 8 Results
- DaveXXXX replied Nov 5, 2012
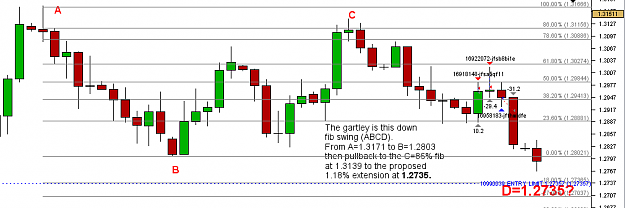
What about 1.2735? — Hey Kambooj, What do you think about a turn around for a bull run from 1.2735 area? It is a fib convergence on the daily chart: A 38.2% fib retrace from 1.2041 to 1.3171. And also a 61.8% fib retrace from 1.2466 to 1.3171. ...
Circular Trendlines
- DaveXXXX replied Nov 1, 2012
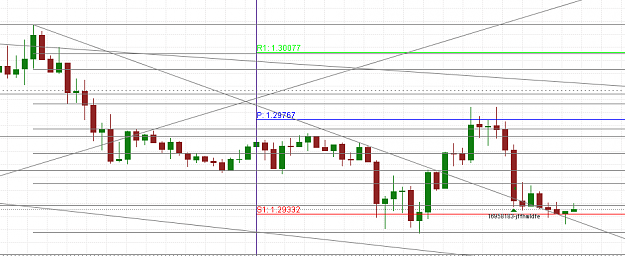
If you have a decent profit that you are happy with I say cash out. Here's why. See the market has touched the back of the down trendline and also the S1 support.:
EURUSD
- DaveXXXX replied Jul 19, 2011
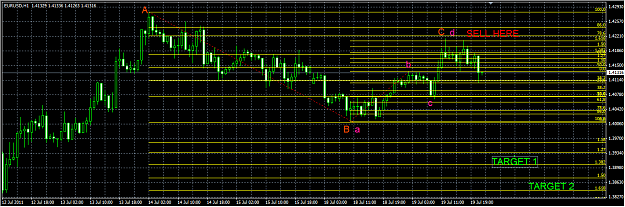
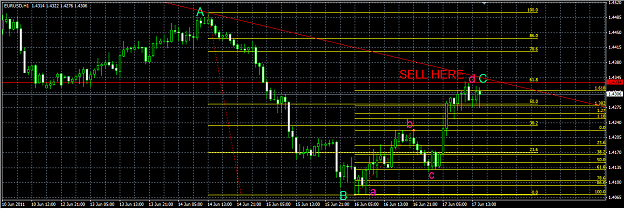
Another Gartley — Looks like another Gartley on the 1HR. I am already in from 4200 as per my last post (was targeting 4175-4190 and went all the way to the 1.618% ext. of the gartley and got up to 4216). Should get down to 3900 and 3850 as per ...
Circular Trendlines
- DaveXXXX replied Jul 12, 2011
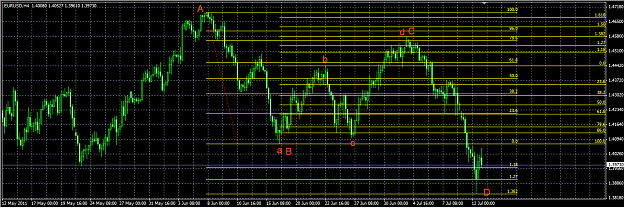
I haven't posted for a while, just been busy. Here is what I saw happening: The small abcd is the gartley for the large ABCD Fib move. Looks like we are ready for a bull retrace now.
Circular Trendlines
- DaveXXXX replied Jun 17, 2011
I agree. I will include my quick analysis in a chart. I hope this doesn't distract anyone from the circle TL's, for me it adds to it.
Circular Trendlines
- DaveXXXX replied Jun 15, 2011
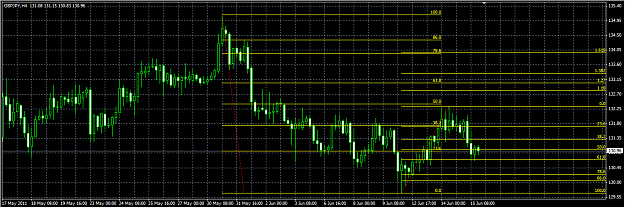
Hi Kambooj, Not sure if you trade GBP/JPY or not. If so, I was wondering what your circle TL analysis says about this possible move north from here. Buy- 130.75 TP- 132.90 SL- 129.58. I tried applying some circular TL's but I am not even close to ...
Circular Trendlines
- DaveXXXX replied May 10, 2011
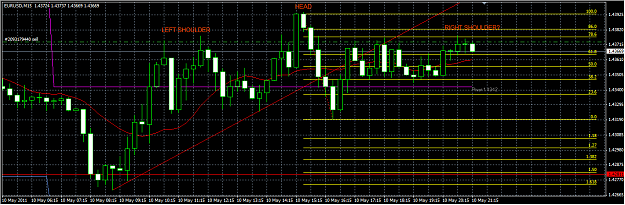
H&S? — Possible Head and Shoulder on the 15min. Doubt it will play out fully considering the market doesn't move much at this time but I am in for a quick scalp.
EURUSD
- DaveXXXX replied Sep 3, 2009
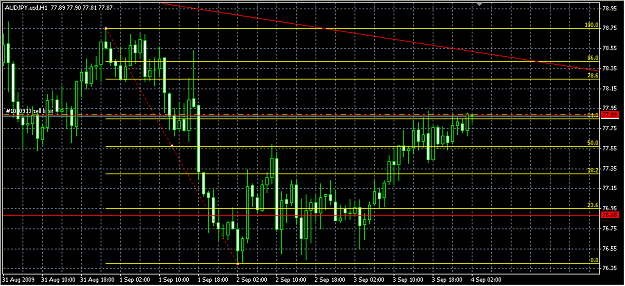
Thought I would give back — Just took a possible short on the AUD/JPY at 77.89. The red line is a previous s/r point from the 4HR chart. That area is also a 61.8% retrace as per the Fibs drawn.
No Brainer Trades
- Posts by Member Search: 'DaveXXXX'