- Search Energy EXCH
- 10 Results
-
 ChaosFrog replied Jun 19, 2017
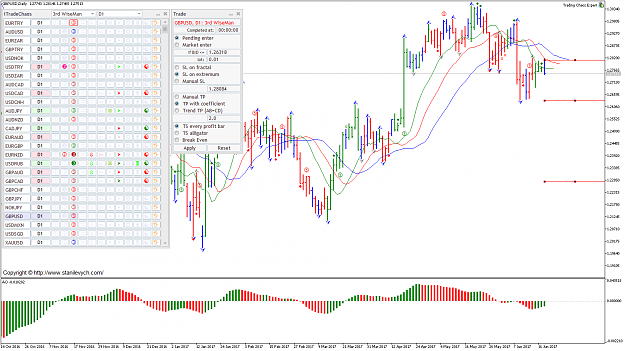
There is a bearish 3d Wise Man and 5th Dimension signal on the daily chart of GBPUSD. Which signal do you like the most?
Profitunity (Chaos) Trading System by Bill Williams
- ChaosFrog replied Jun 19, 2017
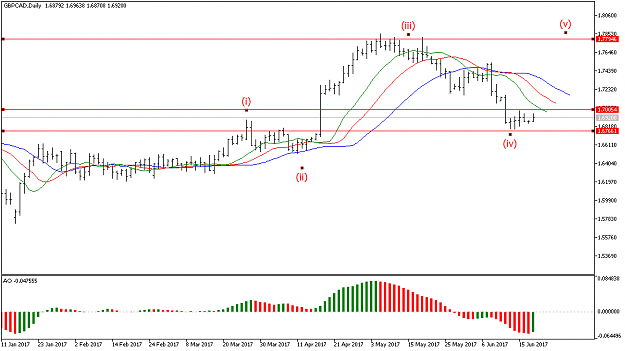
Seems like GBPCAT is the end of 4th Elliot wave. Going to open long after 1.70054 breakout, with SL at 1.67661 and TP 1.77946 (5 wave).
Cable Update (GBPUSD)
- ChaosFrog replied Jun 16, 2017
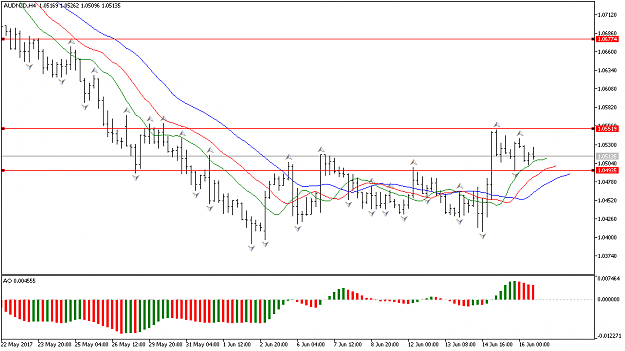
Beginning of a new bullish trend on H4 chart. Placed pending buy order at fractal level (1.05519).
AUDNZD
- ChaosFrog replied Jun 15, 2017
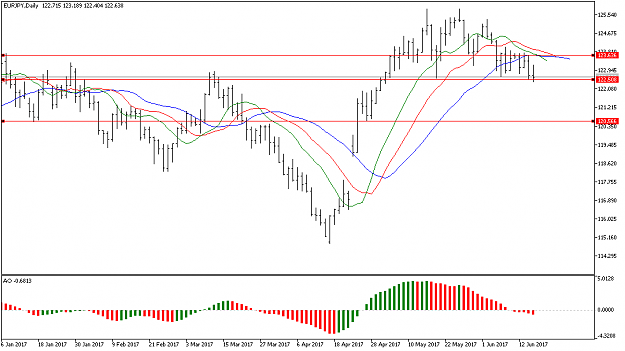
There is a bearish "push" signal by Larry Williams` trading strategy on the daily timeframe. Selling from 122.508.
EUR/JPY
- ChaosFrog replied Jun 15, 2017
Formed bullish pin bar with angulation on the daily timeframe. Opening long after previous bar high breakout.
USD/CAD
- ChaosFrog replied Jun 14, 2017
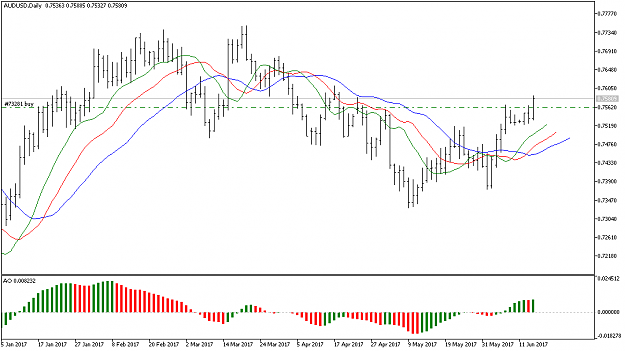
Opened long at BLS signal and added at the daily fractal. Expecting further growth.
AUD/USD
- ChaosFrog replied Jun 13, 2017
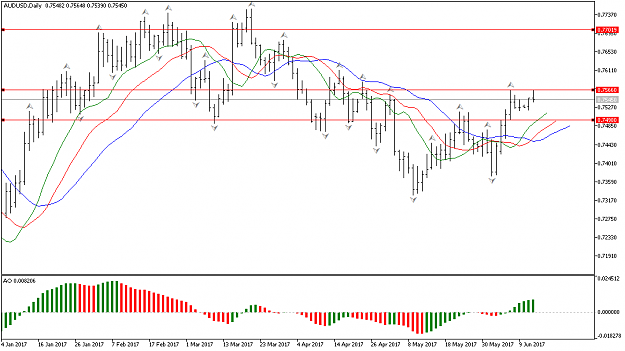
Opening long in case of fractal breakout on D1 (0.75660) with SL at 0.74980 and TP 0.0.77019
AUD/USD
- ChaosFrog replied Jun 12, 2017
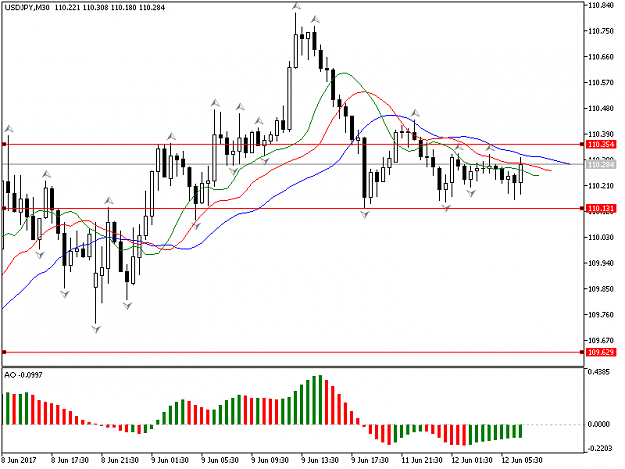
USDJPY is in a down trend on both daily and M30 chart. Will open short in case of fractal breakdown (110.131) on M30 timeframe with stop at 110.354 and tp - 100.629
USD/JPY Discussion
- ChaosFrog replied Jun 7, 2017
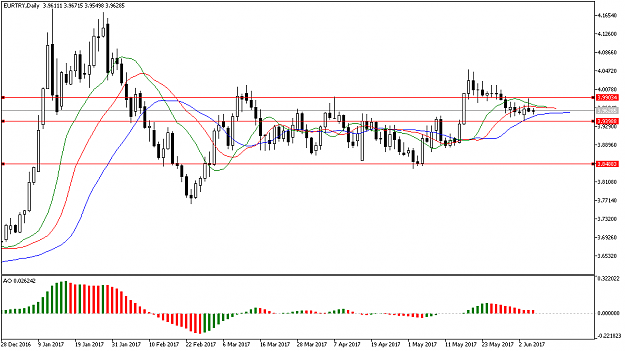
Didn`t find EURTRY topic so couldn`t resist sharing a sell signal on D1 timeframe - "Balance Line" by Bill WIlliams TS. The signal has formed recently, my entry levels are: Sell-stop - 3.93989; Stop-loss - 3.99034 and Take-profit - 3.84883. What do ...
USD/TRY
- ChaosFrog replied Jun 6, 2017
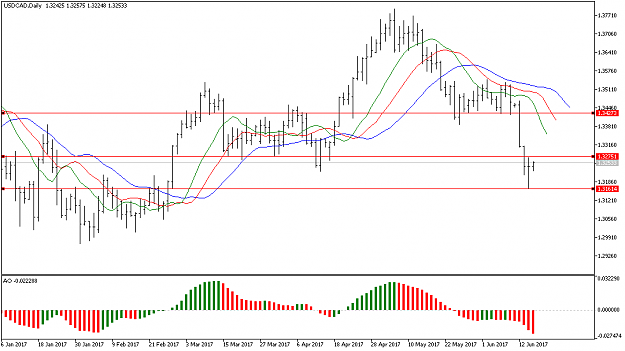
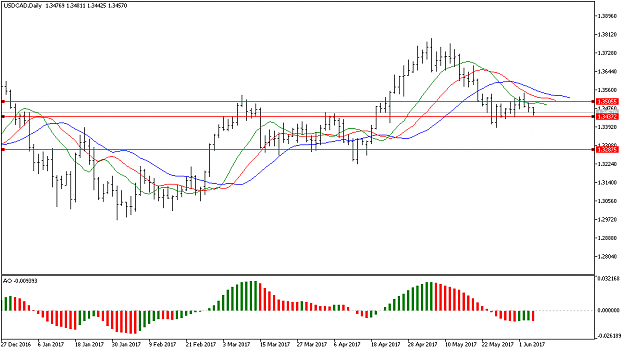
Seems like a clear bearish trend on D1 timeframe: below Alligator indicator + AO below the zero line and in the red zone. Would go short from 1.34372 with stop at 1.35055 an TP at 1.32875
USD/CAD
- Posts by Member Search: 'ChaosFrog'