- Search Energy EXCH
- 32 Results
-
 BudFox replied Sep 28, 2010
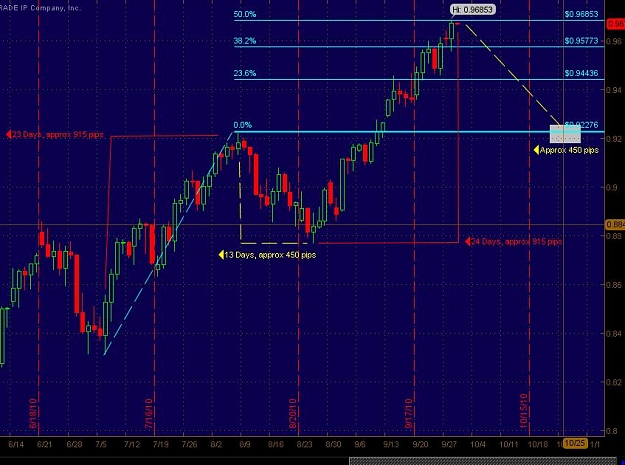
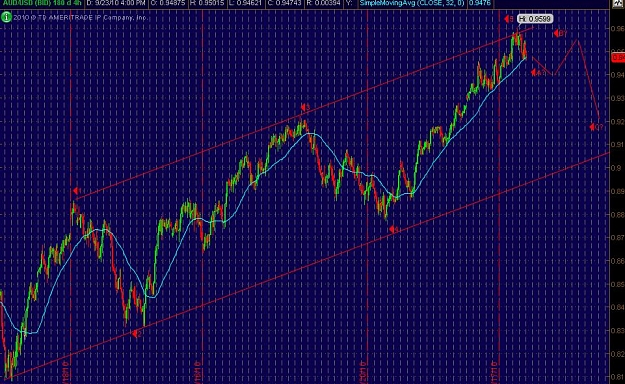
Thought I'd post the below chart, its pretty self explanatory. I'm not calling this a top, but it would seem we are due for a correction. The confluence of the .50 fib extension and the amount of days and pips is why I'm taking a short, also could ...
AUD/USD
- BudFox replied Sep 23, 2010
Very basic EW count below, I could be way wrong, I'm not much of an Elliotishan(sic?). Thoughts?
AUD/USD
- BudFox replied Sep 23, 2010
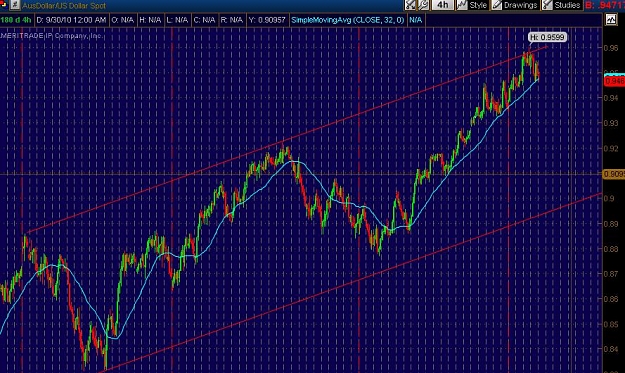
Well, moving very well ATM. Below is my 4h chart I've been watching very closely, I'd like to see it break my SMA, which if that occurs, there could be a quick drop to ~94. The move earlier in the day i'm confident now was a shake out of the weak ...
AUD/USD
- BudFox replied Sep 16, 2010
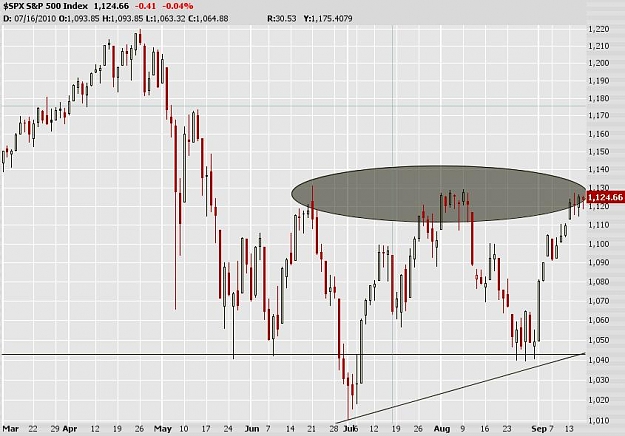
Fundamentally, well, there is a couple of risk events going on tomorrow, US AM. Technically, regarding US equities you'll notice the obvious resistance zone we are encountering now. Looks bearish to me, major resistance which we gapped up to on ...
AUD/USD
- BudFox replied Sep 16, 2010
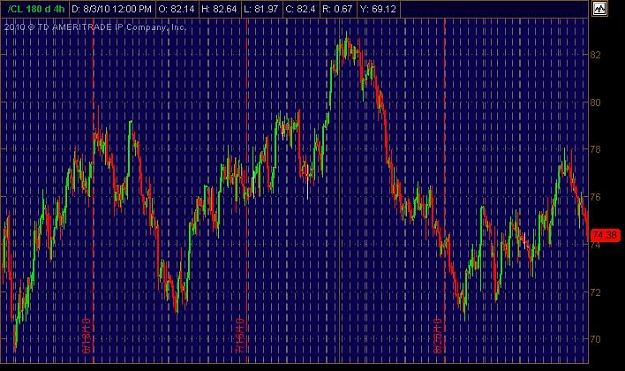
Good point, also look at a crude chart, looks farily bearish to me, possible move towards $72-$70 looks possible. Could end up being a HS pattern as well, time will tell.
AUD/USD
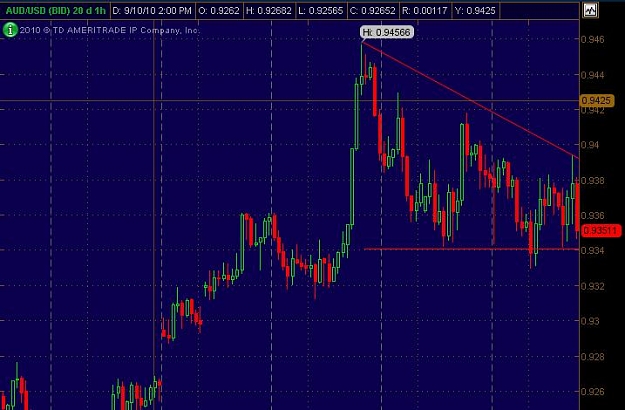
- BudFox replied Sep 16, 2010
Possible descending triangle (not very pretty, i know). Still holding my short from two days ago, will see how PA is now that its back around 9350, a break below 9325 could bring ~9225 into play A sell off in US equities this afternoon could help ...
AUD/USD
- BudFox replied Sep 15, 2010
Interesting spike occured a few mins ago. Anyways, I'm looking at this pair with a short bias, have already been stopped out on some previous shorts from last week, perhaps now I'll have made a profitable trade? Interesting note on the SP500 (I ...
AUD/USD
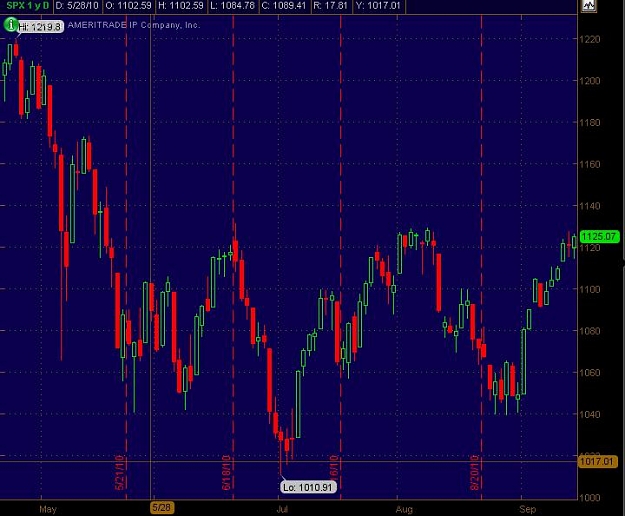
- BudFox replied Aug 31, 2010
Wanted to attach my SP chart. 1065-1040 is the range I see in this chart, also a TL coming up from the low in Jul '09. A break below these supports should mean a move a south for the aud/usd, of course a bounce from the TL and a rally from 1040 ...
AUD/USD
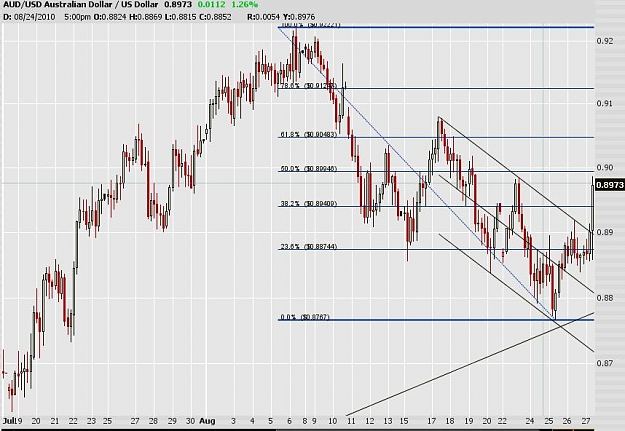
- BudFox replied Aug 27, 2010
Clear break above this trendline, anyone think the 50 fib will hold this thing down, also could it end up being some kind of double top at ~92? Heard an interesting fact about the 2nd to last trading day in Aug. apparently only once in the past 13 ...
AUD/USD
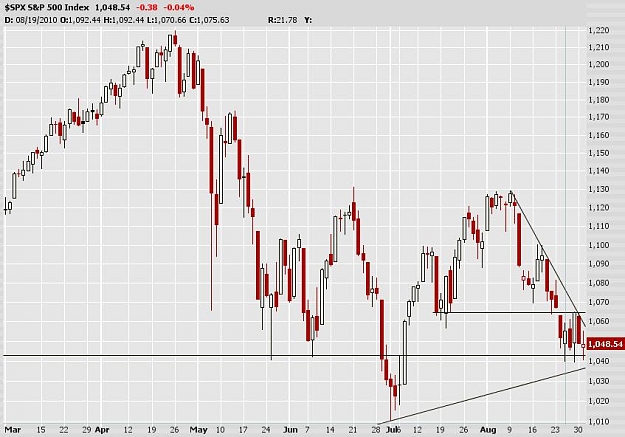
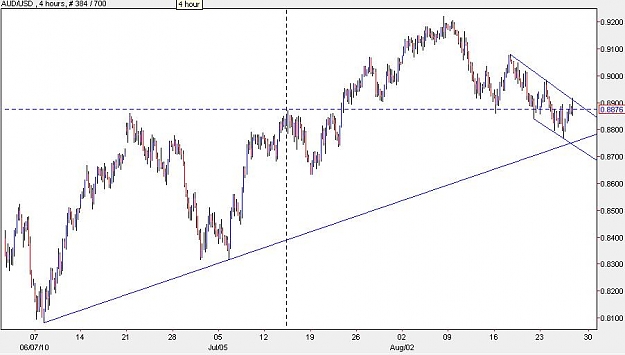
- BudFox replied Aug 26, 2010
Looks like a pretty clear down trend channel on the 4H TF, anyone have thoughts on this breaking through the daily up trend line? Probably will have bad news tomorrow on US GDP and who knows what BB is going to say, but I'd think US equities will be ...
AUD/USD
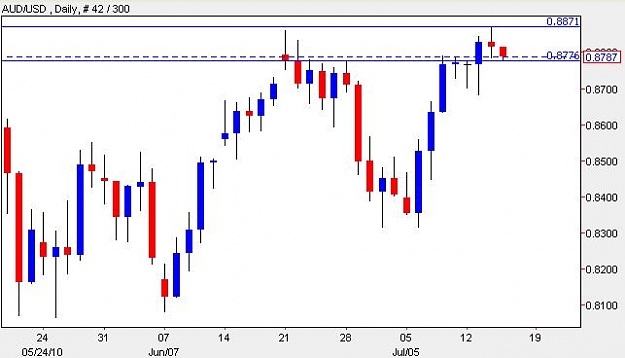
- BudFox replied Jul 14, 2010
See below daily on A/U, I've been eyeing that outside bullish candle since it closed the other day, technically things appear to me to show more upside, possibly breaking the current range, that double top and the 100MA. This could be a great entry ...
AUD/USD
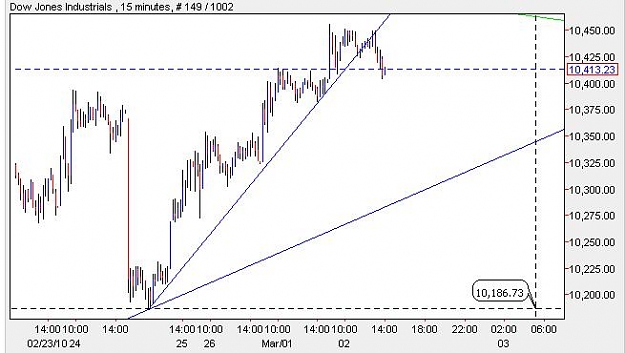
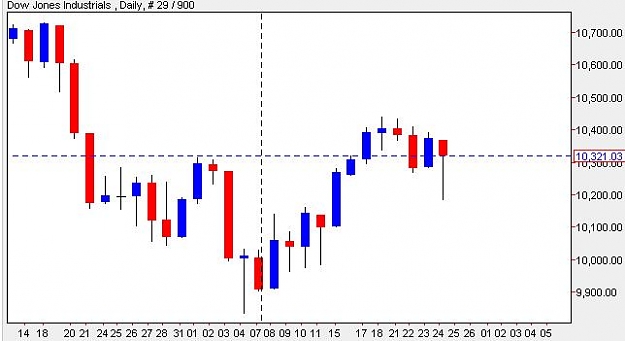
- BudFox replied Mar 2, 2010
If the US equity & e/u correlation holds true possible move south is upcoming according to my analysis, pretty basic but I like to keep it simple. See DJ charts below, should be self explanatory. I could be way wrong and so goes my internet ...
EURUSD
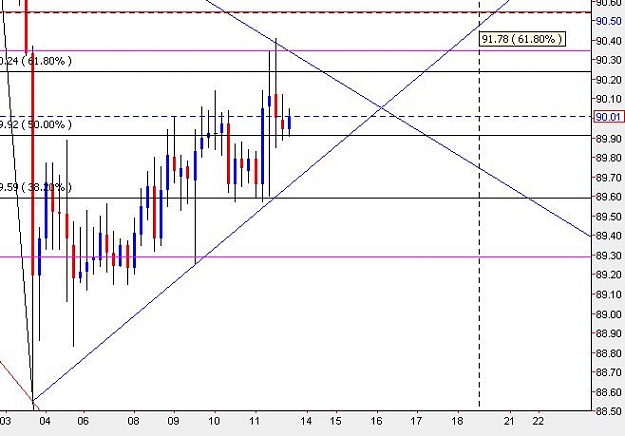
- BudFox replied Mar 2, 2010
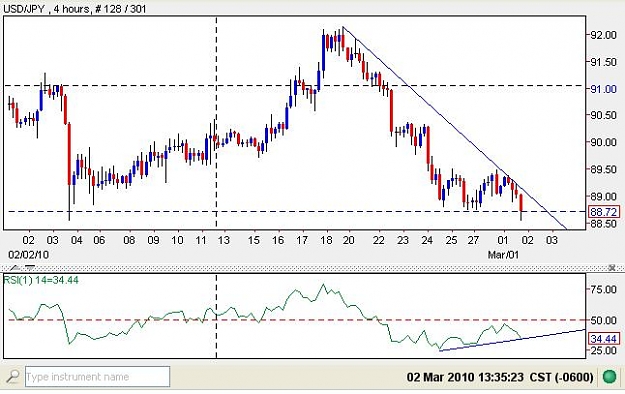
I think this is what he is talking about, see chart below. I've been shorting the US session, and made a little scalp on the long side when it hit 88.58, already closed for a tiny profit. Went ahead and opened another short though at 88.71, b/c of ...
USD/JPY Discussion
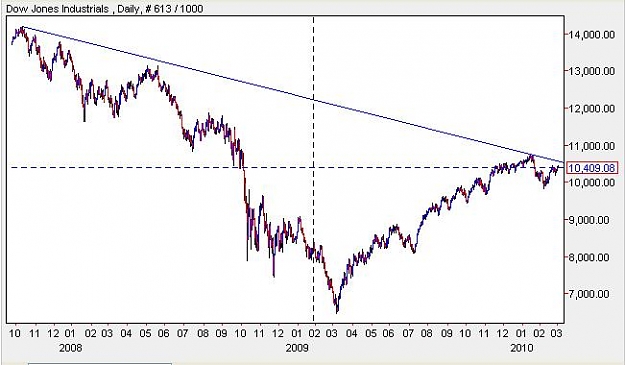
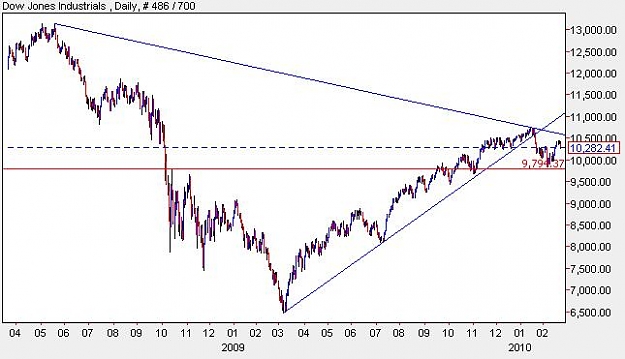
- BudFox replied Feb 25, 2010
Thats a bold statement, to each there own I suppose. On a different note, anyone think this could be a hanging man? looking at DJ, see daily chart below. It did break my ascending TL on H4 today but quickly came back, quite interesting. How long can ...
EURUSD
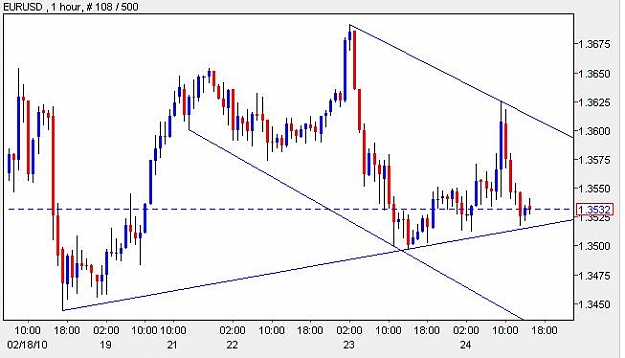
- BudFox replied Feb 25, 2010
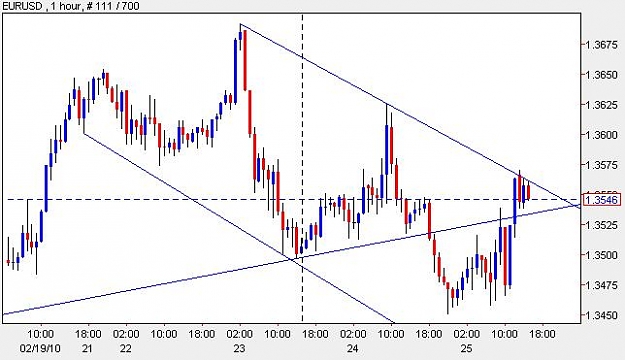
Afternoon gents, haven't been in the market since Tokyo where my short hit its TP, looks like I missed some good action through London and NYC. ATM E/U is repecting that H1 channel I posted yesterday, although it didn't make it all the way to the ...
EURUSD
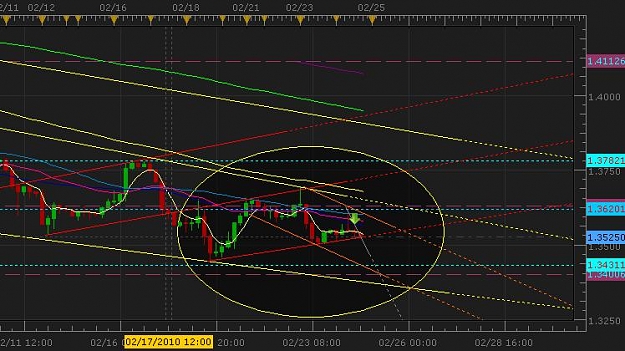
- BudFox replied Feb 24, 2010
I don't typically attach the charts I actualy trade from (no magic secrets, I just know they look sloppy) but I've got a H4 below, with my TLs drawn not to mention a few other things, ha. I too am bearish this pair but have no problem with a counter ...
EURUSD
- BudFox replied Feb 24, 2010
Been drawing lines, possible new channel forming, of course need to break the ascending TL first then possibly target the bottom of the channel. Thoughts?
EURUSD
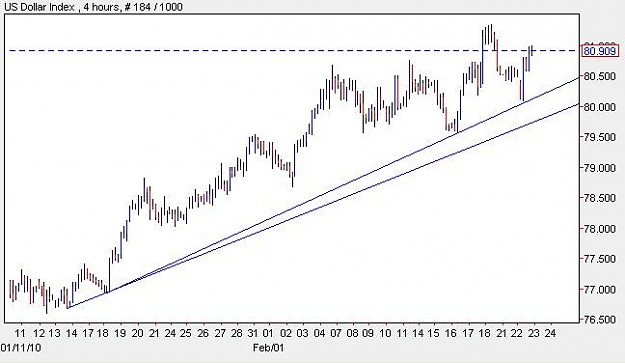
- BudFox replied Feb 23, 2010
Looking at USDX, seems like there could be more upside soon, got a nice bounce from the TL (I'd say its a 3rd bounce). US equities/DJ look like they are in this triangle, also as someone mentioned they stopped dead at the 61 retrace (look at the ...
EURUSD
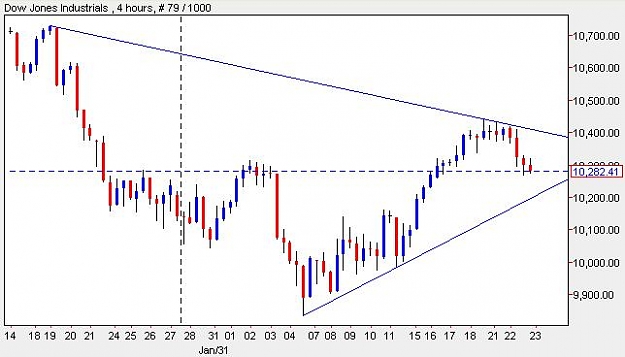
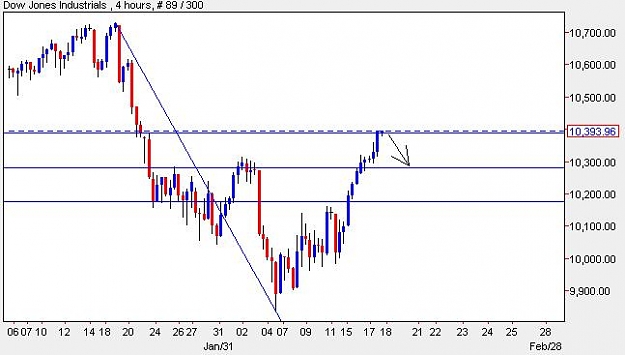
- BudFox replied Feb 18, 2010
Time for US equities to cool off tomorrow, Dow just broke above 61.8 fib from the high of 1/19 to most recent low 2/5. PA look similar to the first big drop on 1/20. Time will tell. Does this mean another leg down for E/U? maybe so. Right now I've ...
EURUSD
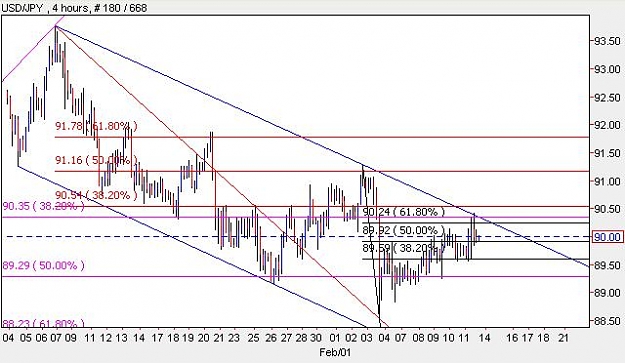
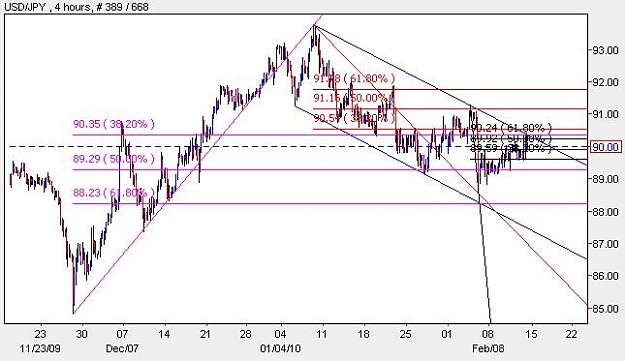
- BudFox replied Feb 12, 2010
Trying to stay patient with my short trade, it should either play out next week or I was wrong. Two charts same lines (I know it looks alittle sloppy). Basically we are at the top of this trend channel which should hold it if we are going to stay in ...
USD/JPY Discussion