- Search Energy EXCH
- 18 Results (1 Thread , 17 Replies )
-
 AmatPro replied May 6, 2008
Thank you Phillip for sharing this wonderful system, thank you Golfer and all the others for sharing all your thoughts and ideas and help. This is my trade of yesterday for usdjpy : 2 descending triangles (resistance marked with green lines). I ...
5Min Intraday System
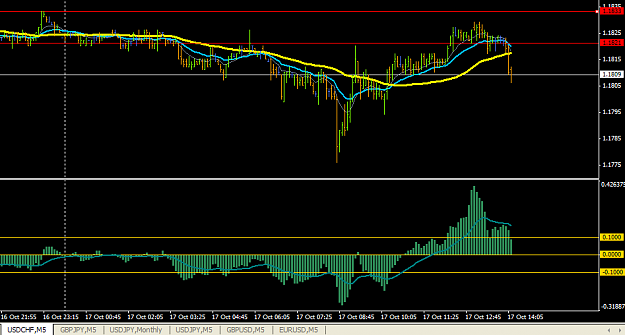
- AmatPro replied Oct 17, 2007
when to exit a bad trade — Hi Philip, thank you for your "FX-gym" (or should we say 'gem'
5Min Intraday System ). I like this lowest risk/high probability strategy a lot. I wanted to know how do you define a 'bad trade'. I have an example here - not from ...
- AmatPro replied Aug 17, 2007
It's what you get when you have a live account at Capital Spreads. Unfortunately it doesn't go back for more years than the ones shown. The firm that delivers the software is url It is ideal for drawing (parallel) trendlines. The ones you see on ...
Recession and FX
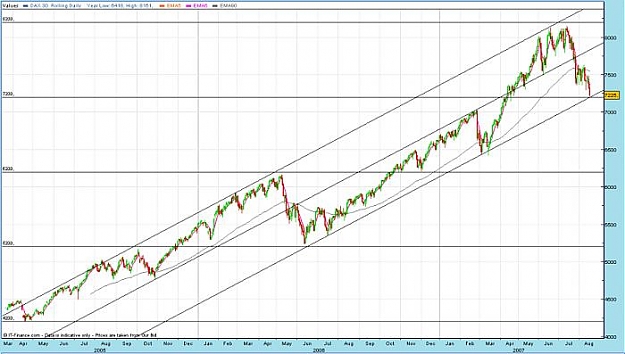
- AmatPro replied Aug 16, 2007
Here is our last hope for the moment, the Dax verry close to double support at 7200. Will it fall through or not? Come and see next hour
Recession and FX :
:
- AmatPro replied Aug 16, 2007
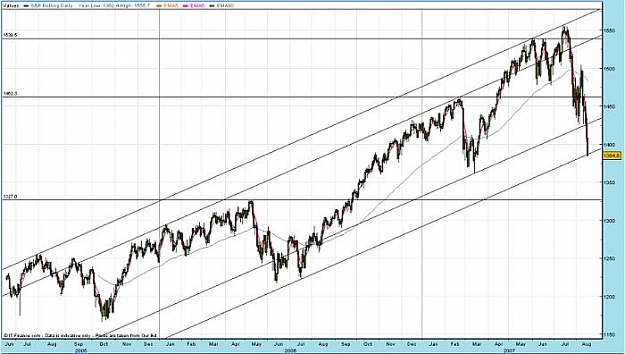
S&P has also fallen under it's ascending support line now:
Recession and FX
- AmatPro replied Aug 16, 2007
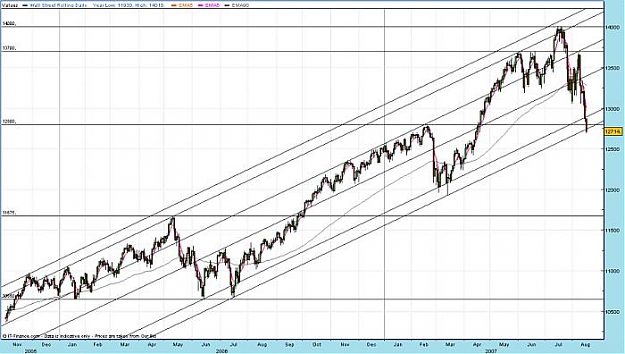
This is the situation at this moment. Dow trading under it's former ascending support line. Looking at the momentum of the 'beast' it may go down to the 12000 level and lower.
Recession and FX
- AmatPro replied Jun 14, 2007
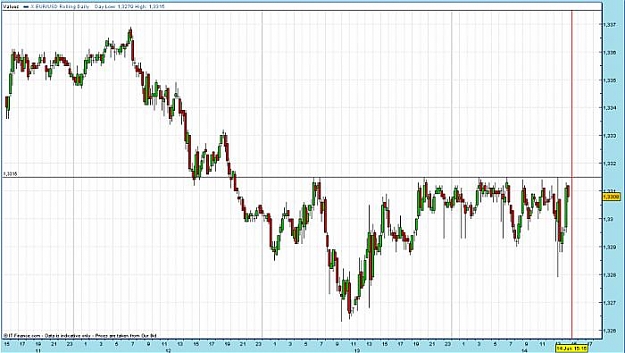
Since yesterday there obviously is some serious defending of the 1,3315 level going on. Who is acting? The ECB? Others? Why?
EURUSD
- AmatPro replied Jun 13, 2007
I just went long on EUR/USD at 1.2378 after confirmation on the 1min. candlestickchart. End of retracement I think. Gap of 16 March 07 and top closure of the first trading day of this year, 2 Jan 07, at 1.3270. And indeed a perfect 50% retracement.
EURUSD
- AmatPro replied May 29, 2007
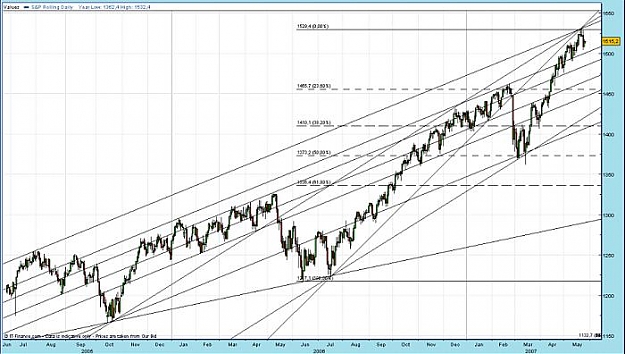
end of 1-year rally? — When we look at the S&P chart, we see 4 technicals converging on the high (1530) of 21st of May 2007 : First of all, the market hit the highest rising resistance line of a series of equidistant rising S/R lines. ...
Stock Indices
- AmatPro replied May 11, 2007
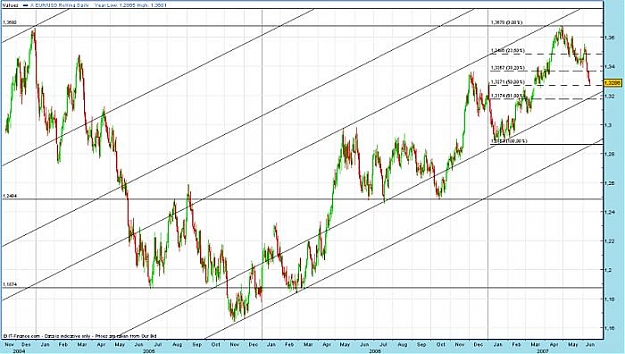
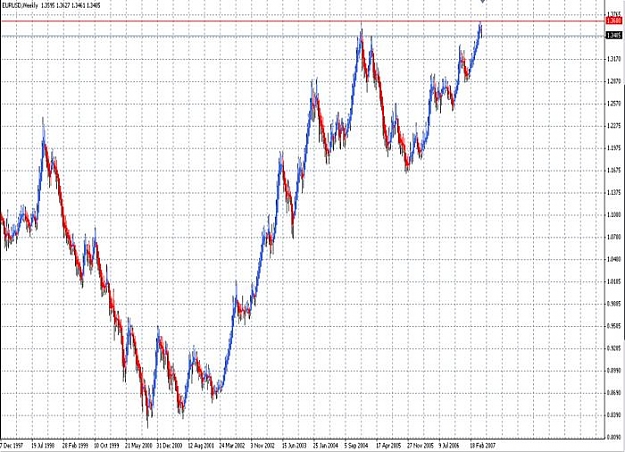
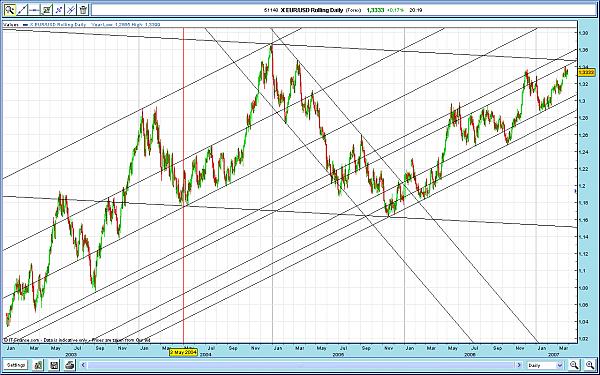
double top? — At newyear 2005 and 1st of May 2007 EURUSD reached the same relative max at about 1.3680 Double top and down for the next years? Or up to 1.5?
EURUSD
- AmatPro replied May 11, 2007
Seems to me you need a stoploss of 500 pips instead of 50.
Trend Following Experiment - EURUSD But you can always get back in at 1.3608 - 50.
  : Good luck.
- AmatPro replied Apr 28, 2007
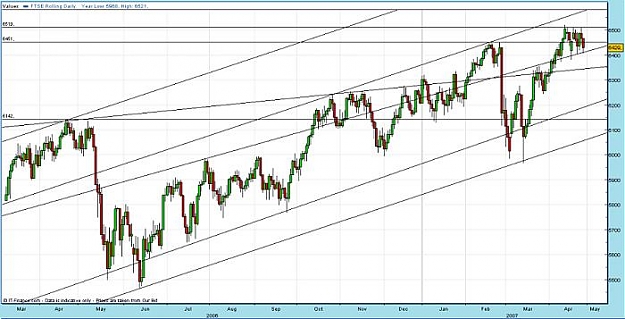
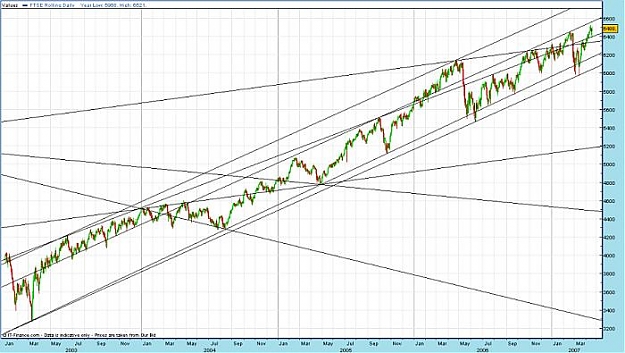
There is a strong indication for reversal 30 april, first May etc. All indexes are converging towards their ascending resistance line on 1st of May. Except for good ol' Footsie, she has been ranging for over 10 days now and even made a triple top at ...
Stock Indices
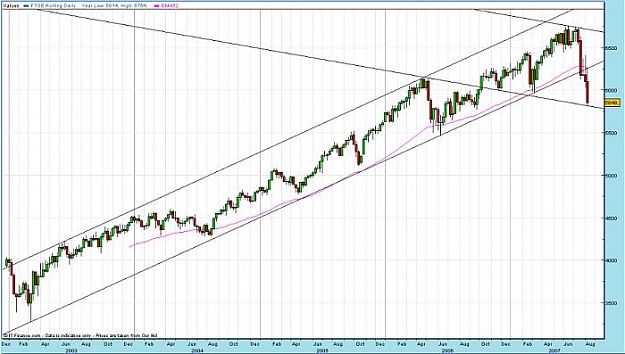
- AmatPro replied Apr 22, 2007
This picture explains why FTSE is mother of all indexes. On last 14 march 2007 when FTSE hit the bottom of a 4 year old channel within A FEW PIPS, and within a few seconds, ALL of the indexes simultaneously went up. And also the USDJPY etc. See the ...
Stock Indices
- AmatPro replied Apr 3, 2007
Fibs are overrated, that's for sure. When I look at this daily chart of the GBP/USD though ...
Are Fibonacci levels overrated?


- EUR/USD bearish from May?Started Mar 29, 2007|Trading Discussion|1 reply

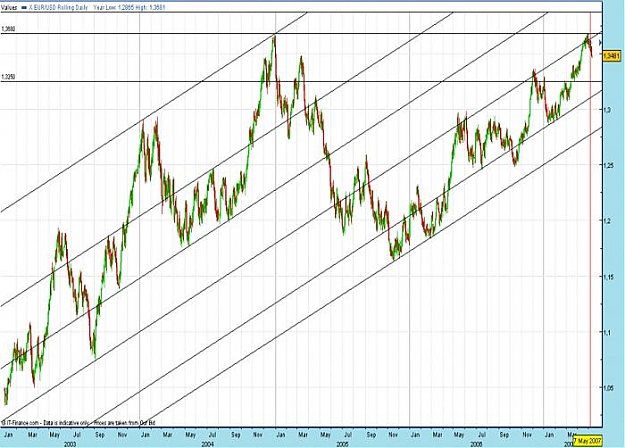
EUR/USD is approaching the 1,35 mark. It is nearing the upside of a channel that is formed by 2 ...
- AmatPro replied Mar 21, 2007
Some Old Hand that can explain a newbie what has happened here at 5 hours before and after 00:00 GMT of 21st march 07? Thanks, AP.
Daily GBP/JPY analysis

- Posts by Member Search: 'AmatPro'