- Search Energy EXCH
- 5 Results
-
 Ahmed elagoz replied Oct 27, 2013
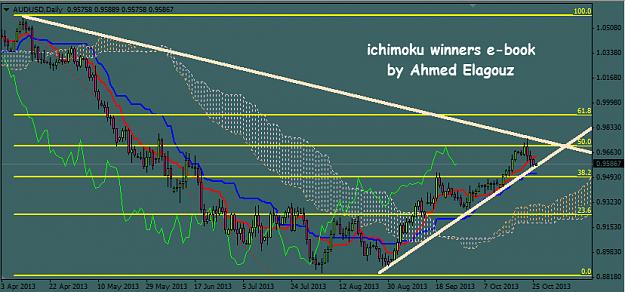
AUD USD Daily chart Tools : 1- Ichimoku Indicator ( Default settings ) 2- fibonacci retracement 3- Manual Trend-lines. Breaking the trend line and going through the Kijun sen will be a good chance to take a short trade and catch some pips after ...
Ichimoku Winners e-book (By Ahmed Elagouz)
- Ahmed elagoz replied Oct 14, 2013
AUD USD Daily Chart Tools : 1- Ichimoku Indicator ( Default settings ) 2- fibonacci retracement 3- Manual Trend-lines. Important narrow area on the daily chart between a trend line and 38.2 Fibo line. Breaking the trend line and tenkan sen + Kijun ...
Ichimoku Winners e-book (By Ahmed Elagouz)
- Ahmed elagoz replied Aug 7, 2013
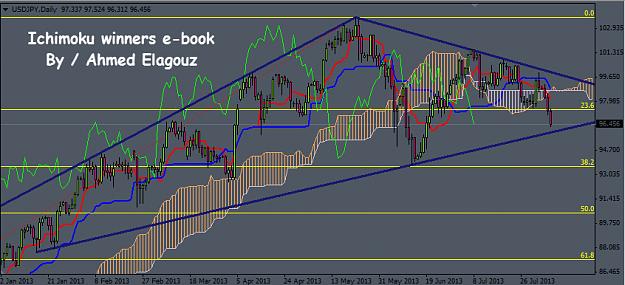
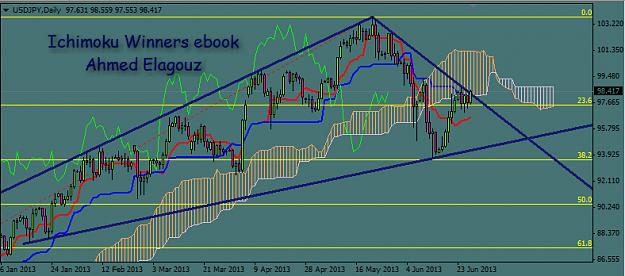
USD JPY Daily Chart Important Trend line after breaking the clouds and 23.6 Fibo line. Looking for breaking the trend line going to 38.2 Fibo OR touching the trend line and go back up near the clouds. ...
Ichimoku Winners e-book (By Ahmed Elagouz)
- Ahmed elagoz replied Jul 1, 2013
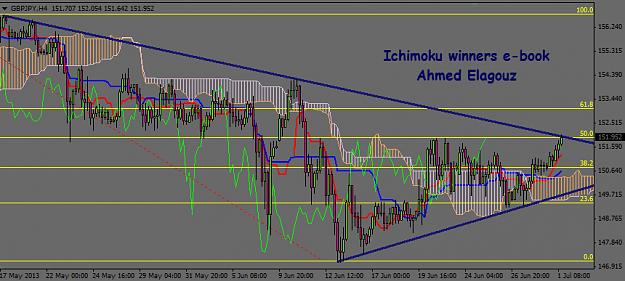
GBP JPY H4 chart Tools : Ichimoku indicator , 2 trend lines , Fibonacci Retracement. Important trend line on GBP JPY. Looking for breaking the trend line and the Fibo level to continue moving up , Or going back to touch the clouds. ...
Ichimoku Winners e-book (By Ahmed Elagouz)
- Ahmed elagoz replied Jun 27, 2013
USD JPY / Daily chart Tools : Ichimoku Indicator - Trend lines - Fibonacci Retracement Strong Resistance Area on the Daily chart. The price is touching the Clouds and the trend line.Looking for catching shorting trades after closing the price under ...
Ichimoku Winners e-book (By Ahmed Elagouz)
- Posts by Member Search: 'Ahmed elagoz'