- Search Energy EXCH
- 63 Results
-
 silversurfer replied Jan 15, 2024
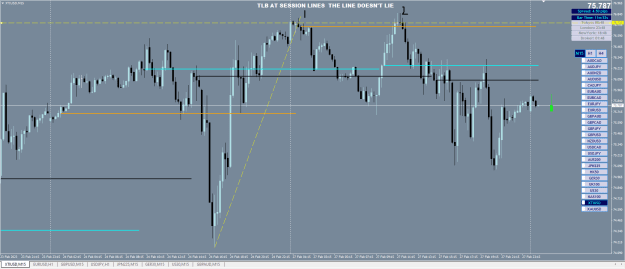
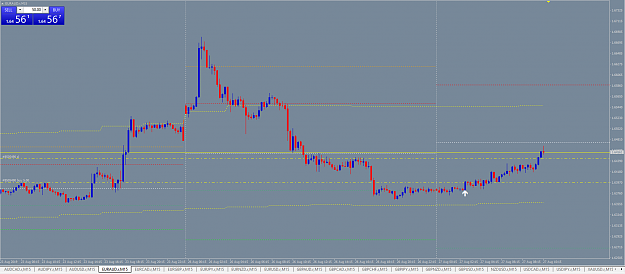
Kirk I'm just using the standard settings and casn't get the arrows to show - what have I missed? image
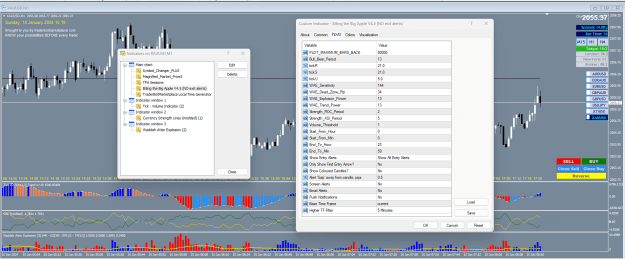
Biting the Big Apple - XAUUSD M1 trading London close / NY open
- silversurfer replied Feb 27, 2023
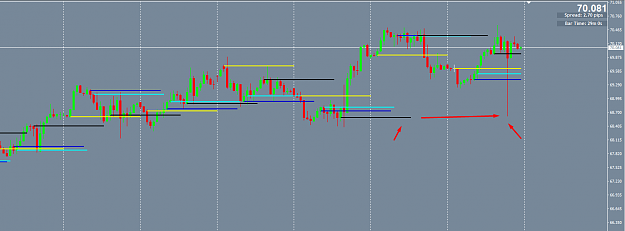
Here is an example of what I look for in a Trend Line Break trade. This XTIUSD on M15, 1 shows where the up trend finished, 2 shows how price went back and tested that area and subsequently fell. Very little drawdown, in my humble opinion a textbook ...
Simple Trendline Orderflow System
- silversurfer replied Jan 23, 2023
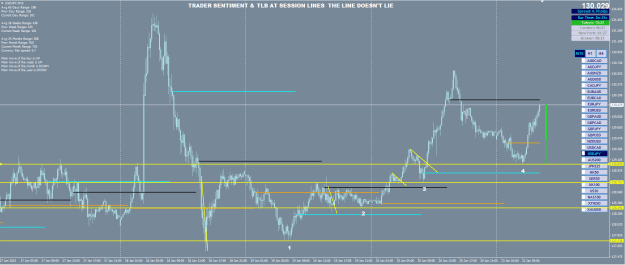
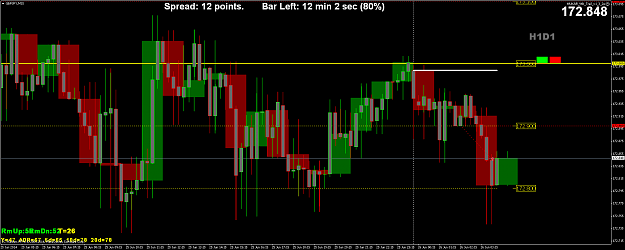
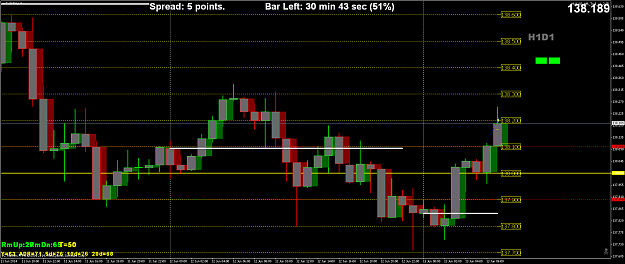
Sorry Harry but I don't look at the thread often as it's dormant most of the time, here's some usdjpy trades of recent times. Trader sentiment today is 60% short usd on FX Blue and the trend is obviously up so go with the trend and look for longs if ...
Simple Trendline Orderflow System
- silversurfer replied Jun 29, 2022
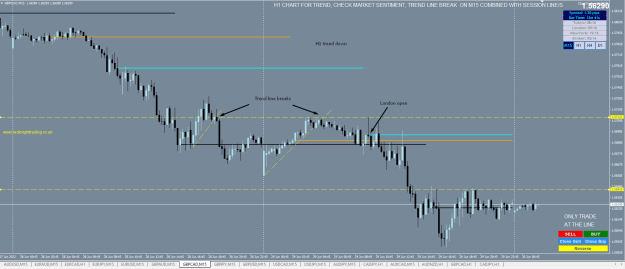
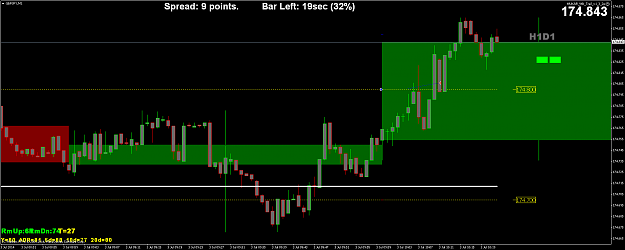
Nice gbpcad M15 trade yesterday at the London open. H1 trend was down, Trend Line Break (TLB) set up came at London open, FXBlue market sentiment showed 86% of traders were long therefore I go short: url . Over 100 pips potential image
Simple Trendline Orderflow System
- silversurfer replied Sep 13, 2021
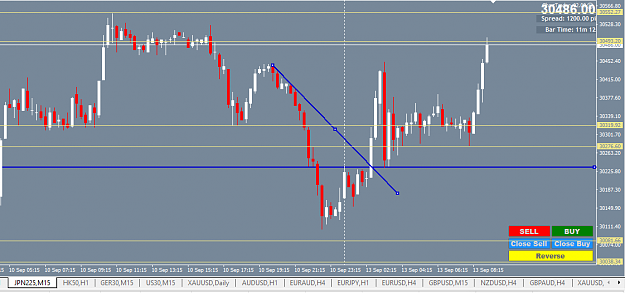
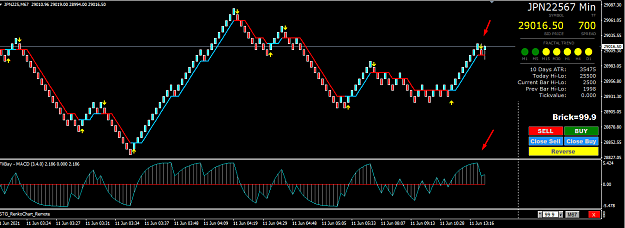
A nice example on JP225 as well image
Simple Trendline Orderflow System
- silversurfer replied Sep 13, 2021
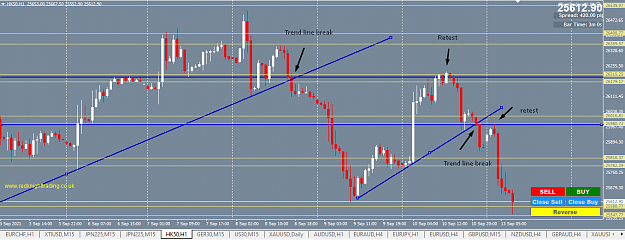
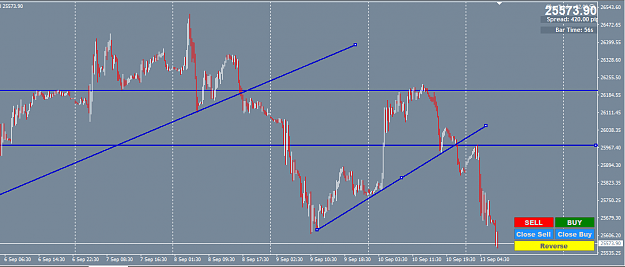
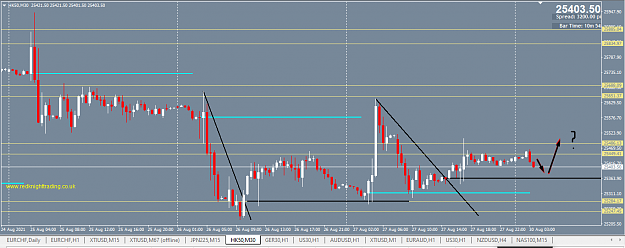
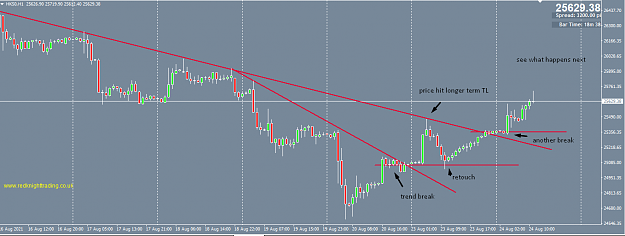
I have been using a simple trendline break and retest inconjunction with the levels and it's no great surprise that they work hand in hand, here are couple of examples on HK50. Search FF for Simple Trendline Orderflow System if you're interested. ...
One of the most Accurate Forex Levels Indicator for MT4
- silversurfer replied Sep 8, 2021
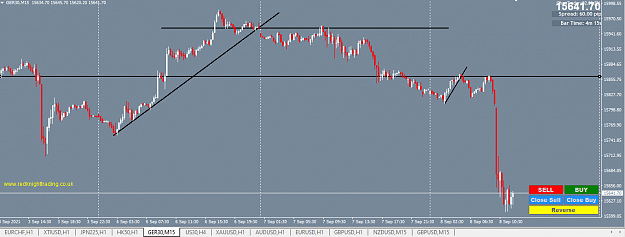
This is a M30 chart that marries up perfectly with H1 & H4 for ger30 image
Simple Trendline Orderflow System
- silversurfer replied Aug 29, 2021
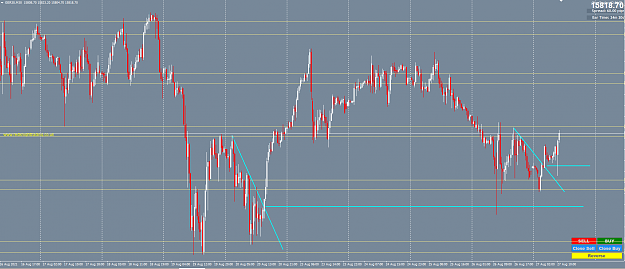
Will lightning strike twice image
Simple Trendline Orderflow System
- silversurfer replied Jun 11, 2021
Hutch a rare example of a signal that doesn't meet the criteria? image
WTI Crude Oil Trading
- silversurfer replied Jun 10, 2021
Here's the chart - black is NY, yellow Tokyo, blue Frankfurt and light blue London image
WTI Crude Oil Trading
- silversurfer replied Dec 22, 2020
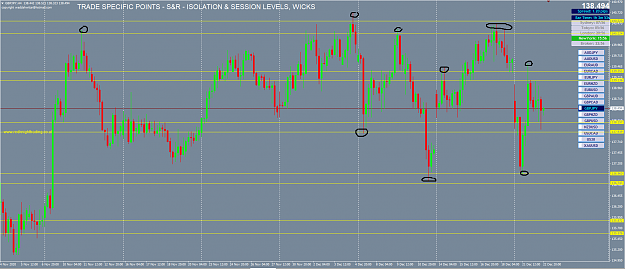
Fred do you pay much attention to wicks when they breach the levels, it seems to me that on the H4 charts when the breach occurs at an extreme or isolated places they give a pretty good indication of a possible turnaround. I've highlighted what I ...
One of the most Accurate Forex Levels Indicator for MT4
- silversurfer replied Sep 8, 2019
url This shows an indicator called symbol changer plus which I got from another forum, quite handy for jumping between pairs. file
(binned per thread starter's request) Beat The Market strategy
- silversurfer replied Aug 27, 2019
Sometimes you can get a little lucky, I took the Ea trade earlier today and am up 65 pips - it probably wasn't technically perfect but the other 2 trades today ENZ +70 and UJ + 33 were. url image
(binned per thread starter's request) Beat The Market strategy
- silversurfer replied Jul 3, 2014
Thought it might be interesting to see someone who got gj compared to someone who was TS on a 1 m chart image
As simple as possible: 00 level trading
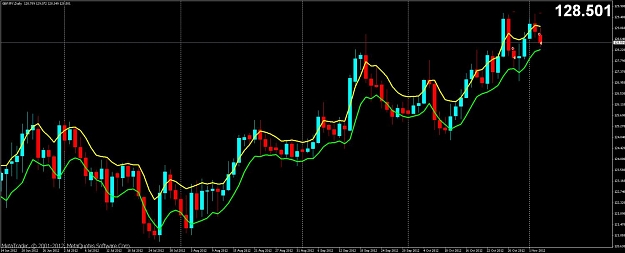
- silversurfer replied Nov 5, 2012
gj — The attached chart shows 2 trades taken on gj for pretty good profits, I don't know how or why this works but it seems to if you apply some commensense on your entries.
The7 Trading System