-
Natural Gas Analysis: Strengthening Trend Signals Potential Upside Breakout Eventually
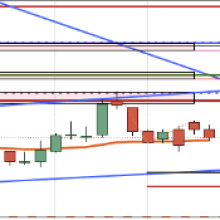
video We can start our analysis of natural gas by observing the 34-Day exponential moving average (EMA) since price bottomed in February at 1.97. At the low the difference between the price of natural gas and the 34-Day line was at a maximum. Price eventually swung back in the other direction, which was up, before touching the line in early-March for the first time since moving below it in mid-December. Natural gas was strong enough at that point to close above it for one day before selling took hold again and pushed prices back down. chart In April, a test of the 34-Day line as resistance continued. There were ... (full story)
- Comments
- Subscribe
-
- Older Stories
 From bnnbloomberg.ca|May 29, 2023
A former Nigerian oil minister filed a defamation lawsuit against the country’s anti-corruption agency, demanding $215 million in damages. Diezani Alison-Madueke sued the Economic ...
 From oilprice.com|May 29, 2023
Brazilian national oil company Petroleo Brasileiro SA (NYSE:PBR) has launched a new commercial portfolio for natural gas in a move that will see the company expand and diversify ...
 From @FirstSquawk|May 29, 2023
post at 3:47pm: OPEC SEC-GEN TO IRAN'S SHANA: OPEC WILL WELCOME BACK IRAN’S FULL RETURN TO MARKET WHEN SANCTIONS LIFTED post at 3:48pm: OPEC SEC-GEN SAYS IN OPEC ALL DECISIONS ARE MADE IN ORDER TO HAVE GOOD BALANCE BETWEEN GLOBAL OIL DEMAND AND SUPPLY - IRAN'S SHANA
-
- Newer Stories
 From nasdaq.com|May 29, 2023
OPEC will welcome Iran’s full return to the oil market when sanctions are lifted, the secretary general of the Organization of the Petroleum Exporting Countries (OPEC) told the ...
 From bnnbloomberg.ca|May 29, 2023|5 comments
The White House and Republican congressional leaders geared up lobbying campaigns to win approval of a deal to avert a US default as environmentalists, defense hawks and ...
 From oilprice.com|May 29, 2023
Asian oil imports were due for a marked rebound this month after the end of the maintenance season. Chances are that a lot of the additional oil would be coming from Russia, which ...
- Story Stats
- Posted: May 29, 2023 6:04pm
- Submitted by:Category: Technical AnalysisComments: 0 / Views: 233