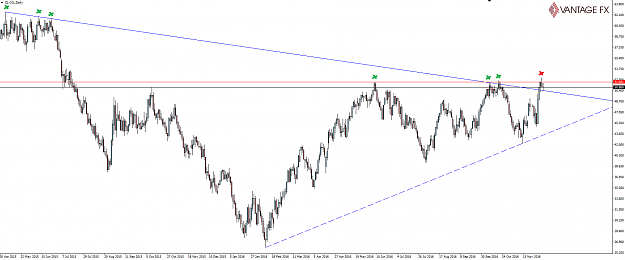
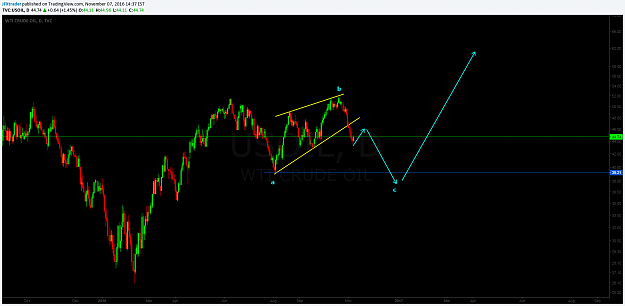
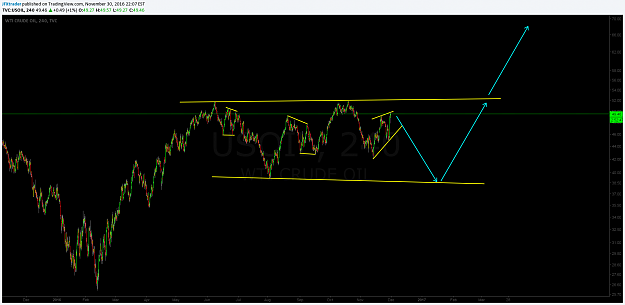
Two days after the Trump win, we have crude trading here in the low 40s. We see this as an excellent entry. We expect crude to be over $90 within a year from now.
Ignored
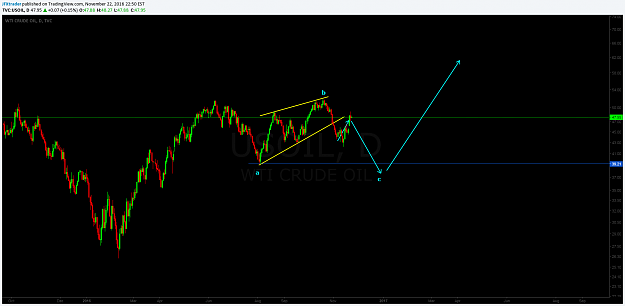
Though crude is up around 14% since our entry, it is still not too late to go long even for the short term. We see good odds for it to break $55 before the end of January. Though our primary play is to see it over $90 before the end of 2017
{quote} Though crude is up around 14% since our entry, it is still not too late to go long even for the short term. We see good odds for it to break $55 before the end of January. Though our primary play is to see it over $90 before the end of 2017
{quote} Though crude is up around 14% since our entry, it is still not too late to go long even for the short term. We see good odds for it to break $55 before the end of January. Though our primary play is to see it over $90 before the end of 2017
Ignored
so, not below 40 we are going to see? my thinking stocks move down would bring oil much below 40 till January..., ??
personally medic, i am not heeding that rhetoric. I don't see crude hitting 90 again for a very long time. but nobody knows for sure.
Ignored
90 - ? it's depends on inflation and it's picking up, in other hand D Trump team yesterday confirm to remove a lot of restrictions set on energy, so, I expecting oil/gas production increase ..., will see..., for now I closed yesterday my oil shorts from 51 and going to wait till thing get more clear...
{quote} so, not below 40 we are going to see? my thinking stocks move down would bring oil much below 40 till January..., ??
Ignored
what we see is that the political forces that pushed down the price of oil and kept it down will ease considerably and that will be the biggest driver of oil to $90+ over the next 12 months
regarding stocks, certainly the path of least resistance is up and a parabolic move higher wouldn't surprise us. But we don't see one driving the other in the near future anyway apart from the correlation of crude prices to the energy sector stocks in the respective indices
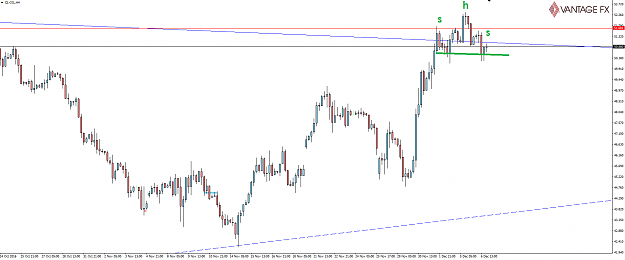
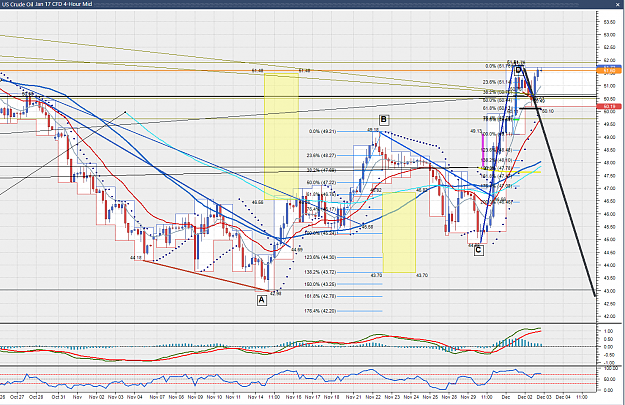
Nice chart on oil above. I guess it is a bit debatable how far Crude Oil is likely to go on this pop. The 4 Hr chart below shows Gartley's 222 pattern, which seems to limit the upside somewhat....
On another matter, AUD/USD seems to be playing out as expected - nearly time to top up position/s IMO.
{quote} Hi Jfrancis, Nice chart on oil above. I guess it is a bit debatable how far Crude Oil is likely to go on this pop. The 4 Hr chart below shows Gartley's 222 pattern, which seems to limit the upside somewhat.... On another matter, AUD/USD seems to be playing out as expected - nearly time to top up position/s IMO. {image}
Maybe Crude oil price action is actually climbing non stop: looks a lot like consolidation before popping higher (bull flag) - however the Gartley 222 pattern suggests lower price action is just around the corner.
If that bull flag/pennant fails (say 50.50 is broken) then one could look for short short/s & see if oil is going your way
Maybe Crude oil price action is actually climbing non stop: looks a lot like consolidation before popping higher (bull flag) - however the Gartley 222 pattern suggests lower price action is just around the corner. If that bull flag/pennant fails (say 50.50 is broken) then one could look for short short/s & see if oil is going your way 4 Hr chart: {image}
Ignored
Hi there
From a FA point of view, what would take oil short ? The only thing I can think of is output cut promises not being enough
WTIC has had a nice bounce in price (up 12 %) on the reported deal, but it is close to a neck line (resistance). We could see short covering on a continued pop, but some indicators/ patterns still suggest lower prices soonish...
1 st chart is 4 Hr WTIC chart: Doji & divergence may well play out...
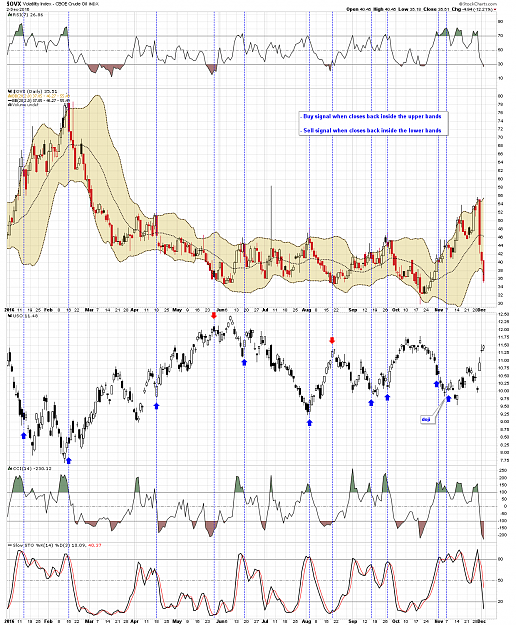
2nd chart is the Crude volatility index looks to be suggesting a reversal in price is around the corner: