"Trading with-trend" is a loaded statement and yet it is the thesis of this thread and one I stick by as the answer to many who are experiencing difficulty with trading.
Say that and you get all kind of questions: What trend? The daily, weekly, etc.? Should I find entries on a lower time frame to get in on a trend in a higher time frame? The questions are endless.
I like to use one time frame and define the trend on that time frame if there is one. I like to see a pair that is already trending so I'm not tied down to any pair or pairs. I just want a pair that is trending on the time frame that I choose.
A trend will exhibit the following characteristics from simple to more complex:
1. If down price will generally be moving from the left upper portion of your screen to the lower right portion of your screen and opposite for an uptrend.
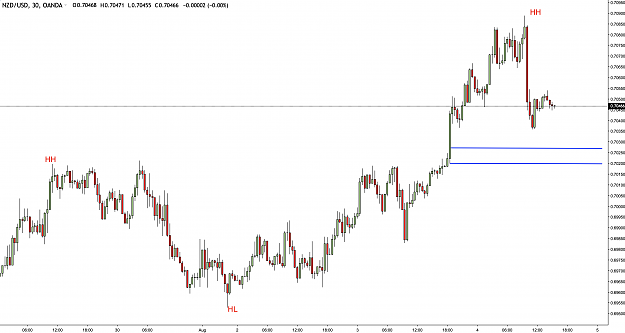
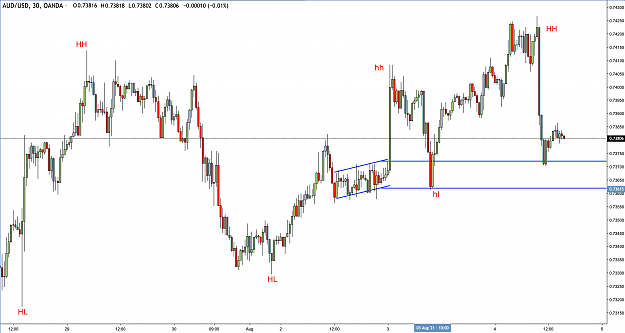
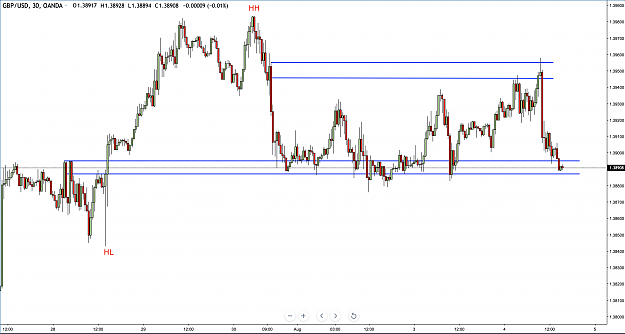
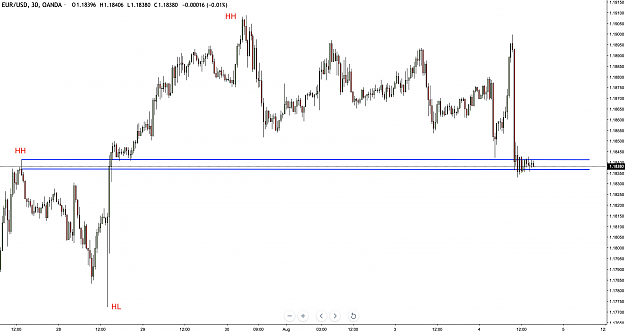
2. As price is trending it will be making making LLs and LHs in a downtrend and HHs and HLs in an uptrend.
3. As price is making HHs/HLs or LHs/LLs it is swinging so we can speak in terms of swings when talking about trends.
4. Swings occur at bar/candle levels then multibar/multicandle levels and larger structural levels.
5. Depending on how far your chart is zoomed in or out you may have trends within trends all with their own swings.
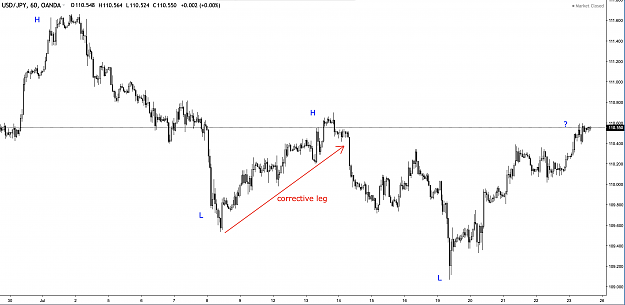
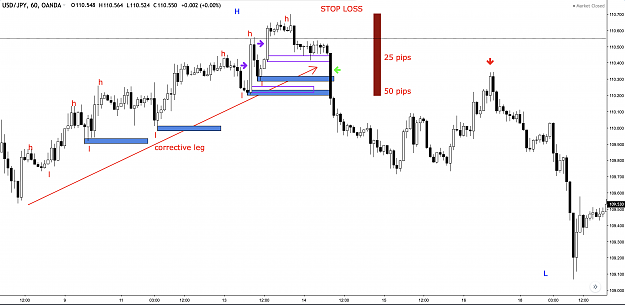
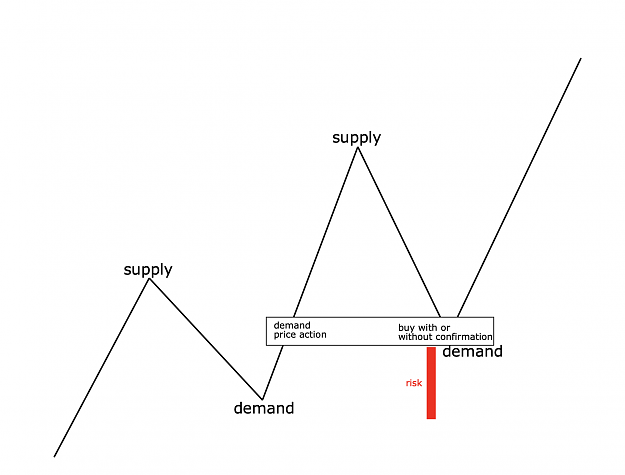
6. Trends are made up of impulse legs and corrective legs which make up the swings.
Trend beginnings and endings:
Most basically trends begin with an impulse leg followed by a corrective leg followed by another impulse leg. The corrective leg will not exceed the first impulse leg origin. A beginning signals the end another trend or does it?
To answer this question we must understand how much data is being looked at. This goes back to how zoomed in or out your chart is. One may ask what it is the best amount of data to have on your screen? Or how zoomed in or out is the best?
There is no right or wrong answer to this question. One may zoom out much to see what the pair has been doing for a longer time in the context of the time frame chosen. Then one may zoom in to see a particular swing sequence. Then even closer to see the price action clearly.
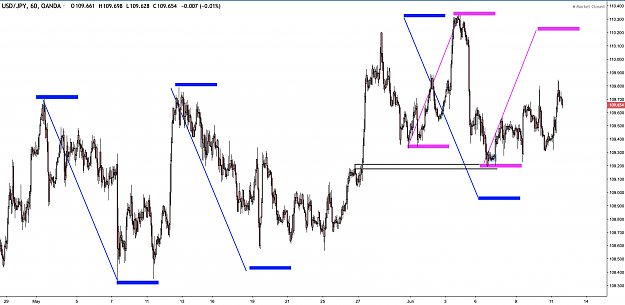
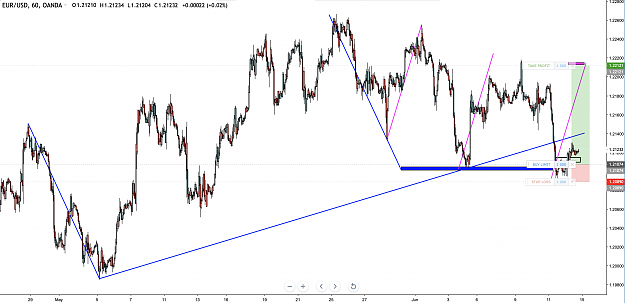
Next we'll look at some charts to go with the above text.
Say that and you get all kind of questions: What trend? The daily, weekly, etc.? Should I find entries on a lower time frame to get in on a trend in a higher time frame? The questions are endless.
I like to use one time frame and define the trend on that time frame if there is one. I like to see a pair that is already trending so I'm not tied down to any pair or pairs. I just want a pair that is trending on the time frame that I choose.
A trend will exhibit the following characteristics from simple to more complex:
1. If down price will generally be moving from the left upper portion of your screen to the lower right portion of your screen and opposite for an uptrend.
2. As price is trending it will be making making LLs and LHs in a downtrend and HHs and HLs in an uptrend.
3. As price is making HHs/HLs or LHs/LLs it is swinging so we can speak in terms of swings when talking about trends.
4. Swings occur at bar/candle levels then multibar/multicandle levels and larger structural levels.
5. Depending on how far your chart is zoomed in or out you may have trends within trends all with their own swings.
6. Trends are made up of impulse legs and corrective legs which make up the swings.
Trend beginnings and endings:
Most basically trends begin with an impulse leg followed by a corrective leg followed by another impulse leg. The corrective leg will not exceed the first impulse leg origin. A beginning signals the end another trend or does it?
To answer this question we must understand how much data is being looked at. This goes back to how zoomed in or out your chart is. One may ask what it is the best amount of data to have on your screen? Or how zoomed in or out is the best?
There is no right or wrong answer to this question. One may zoom out much to see what the pair has been doing for a longer time in the context of the time frame chosen. Then one may zoom in to see a particular swing sequence. Then even closer to see the price action clearly.
Next we'll look at some charts to go with the above text.
1