Chapter 5 - Band-Pass Filters 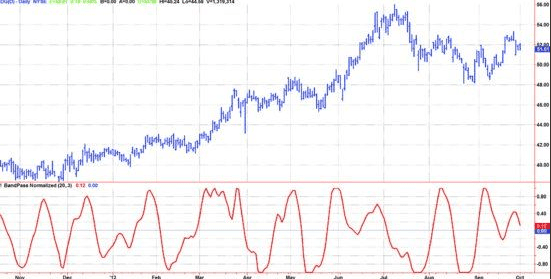
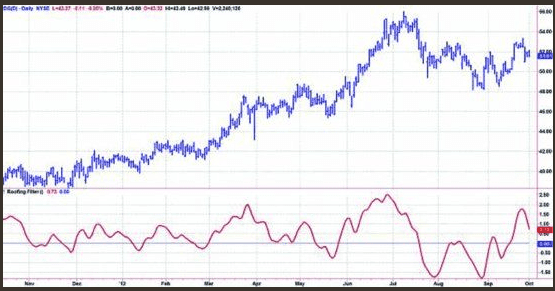
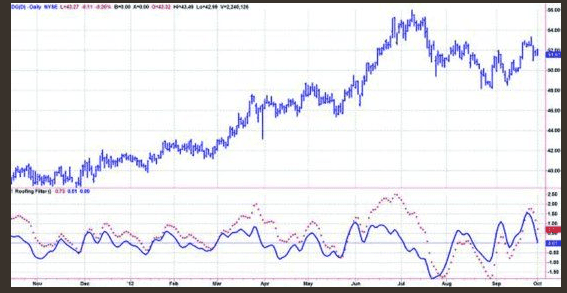
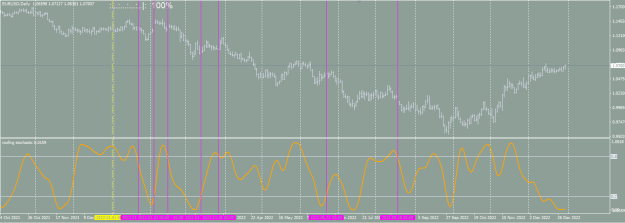
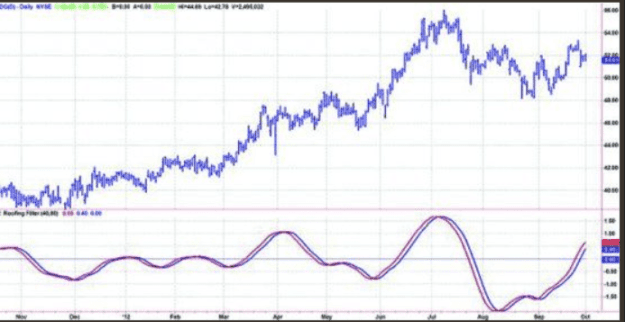
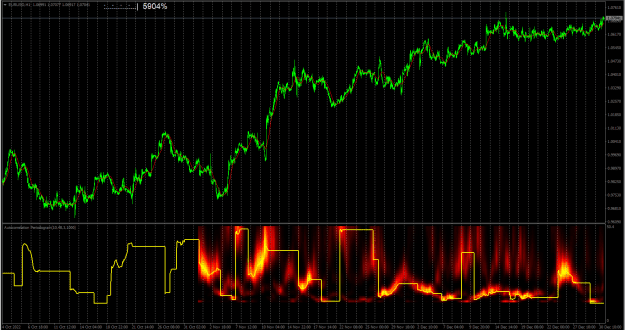
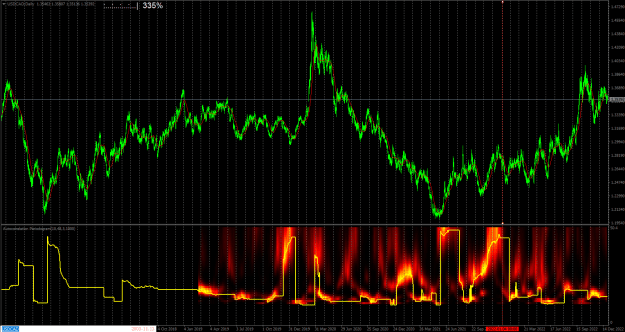
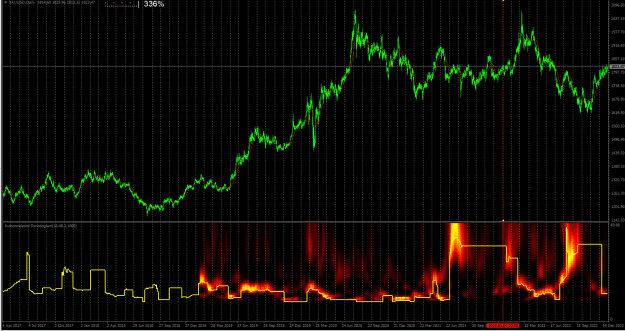
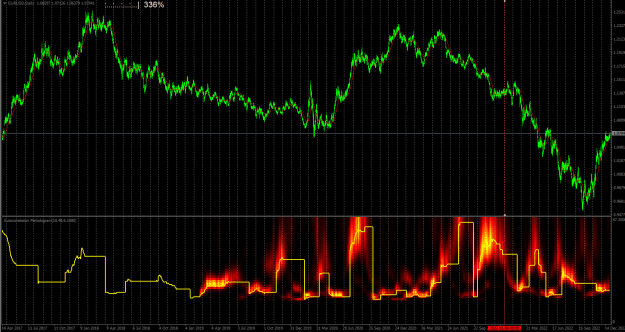
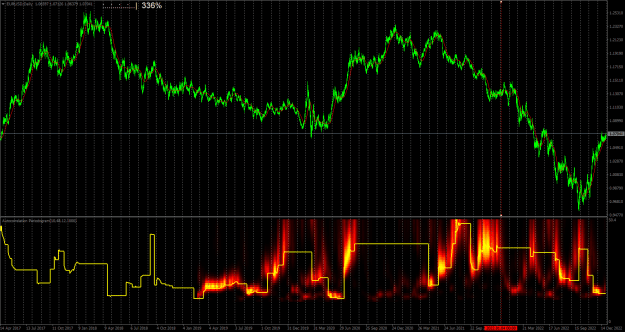
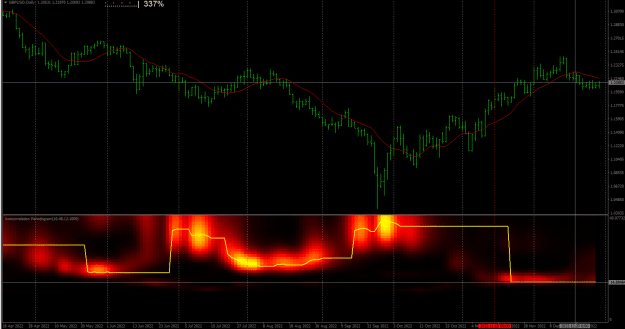
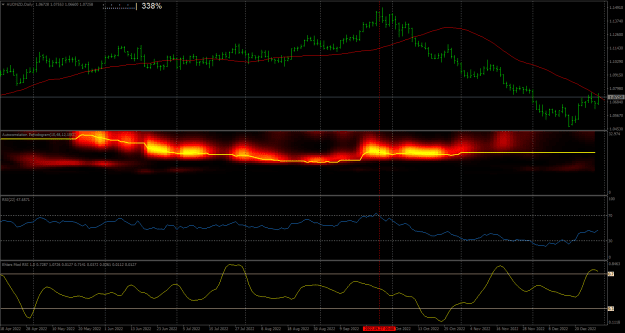
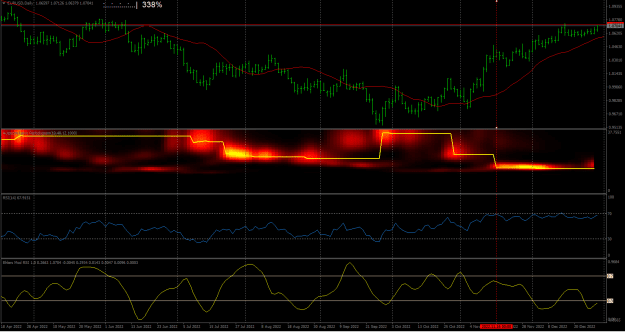
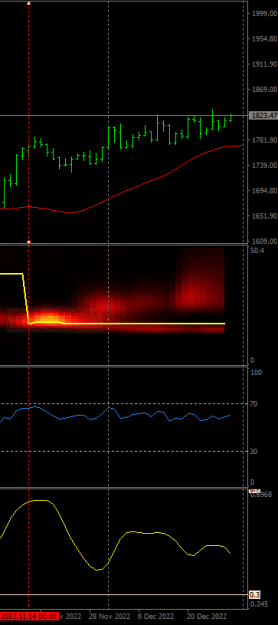
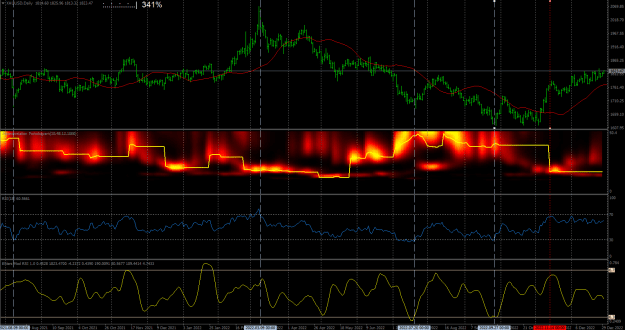
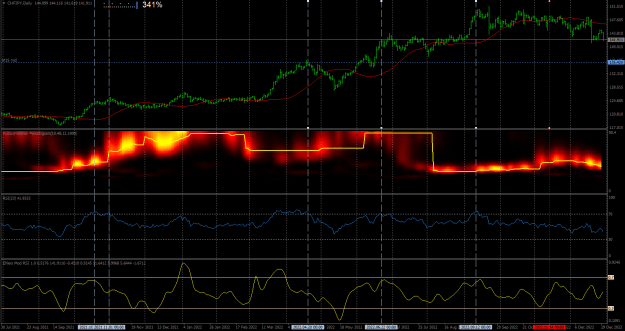
“Note the band-pass filter correctly identifies the peaks and valleys in the data. However, the band-pass filter is dead wrong when the prices go into a trend as in March 2012 and June and July 2012.”
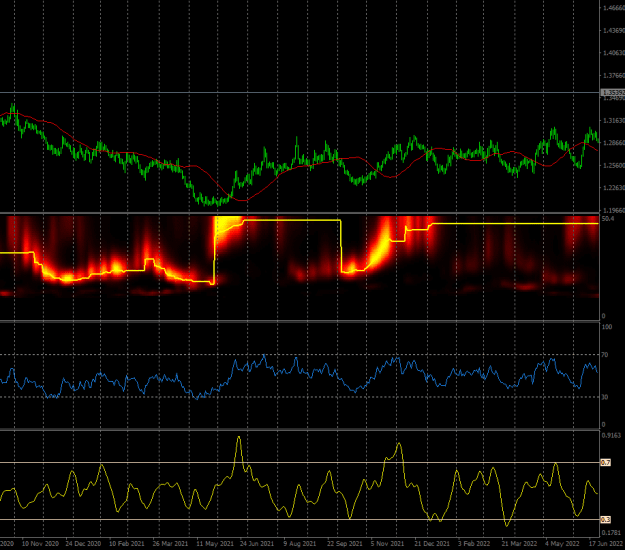
- A band-pass filter is both a detrender and a smoother combined
- Attenuation of out-of-band frequencies is superior to high-pass and low-pass filters because the ‘rejection’ is scaled to the bandwidth of the filter
- A band-pass filter tuned to a ‘consistent dominant cycle’ (a unicorn!) has no lag
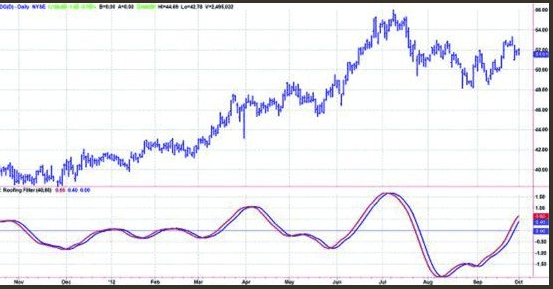
- A narrow pass-band filter is slower to react to changes in the input data. A wider pass-band filter adapts more quickly to changes in the input data.
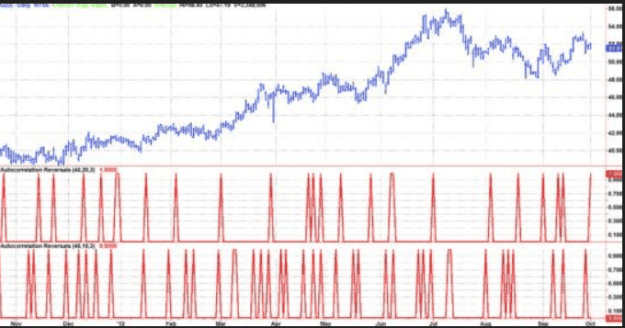
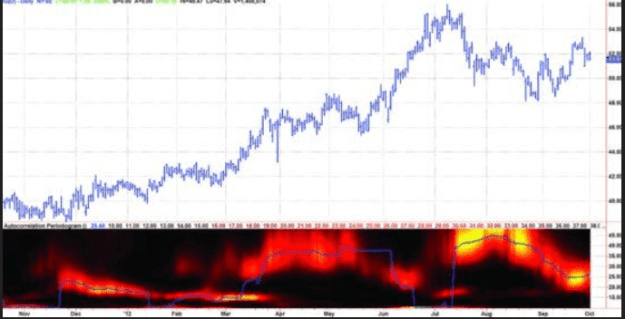
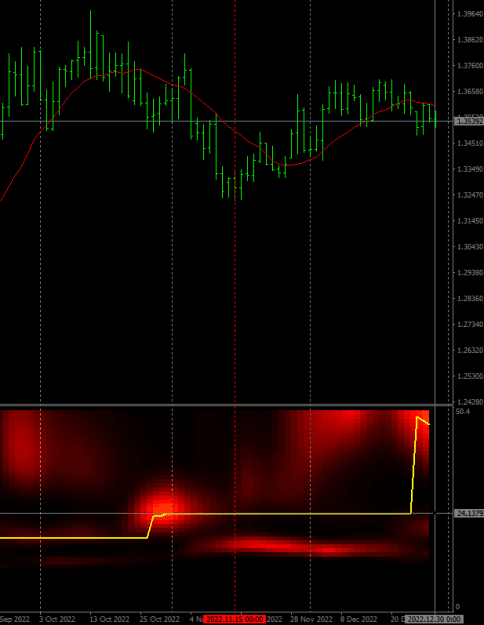
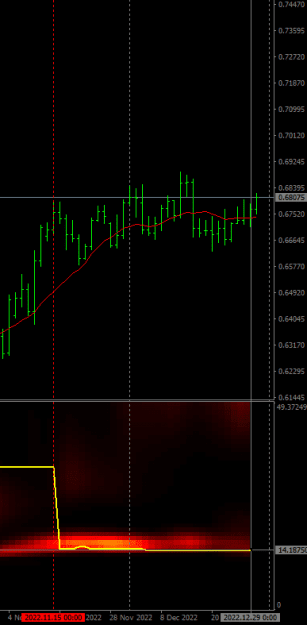
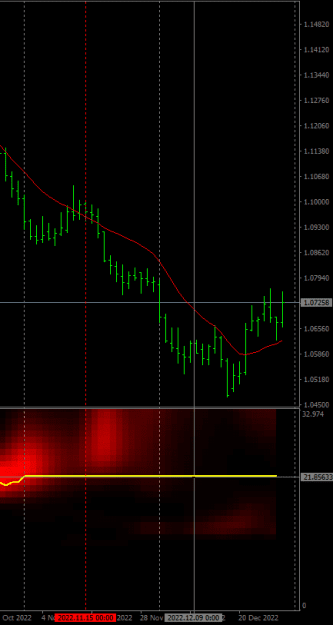
- The dominant cycle period of the data can be estimated by counting the number of bars between zero crossings of the band-pass filter output.
Attached Image (click to enlarge)
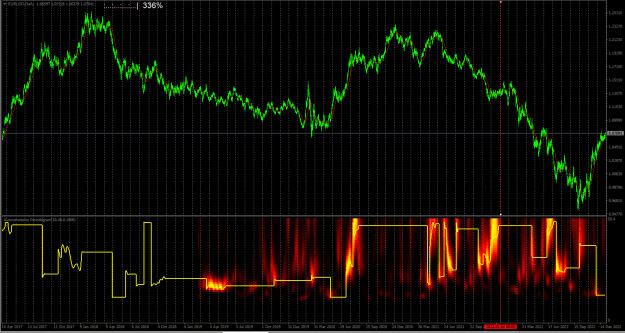
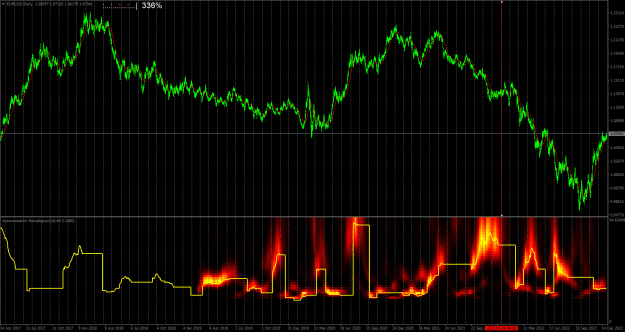
“Note the band-pass filter correctly identifies the peaks and valleys in the data. However, the band-pass filter is dead wrong when the prices go into a trend as in March 2012 and June and July 2012.”
1