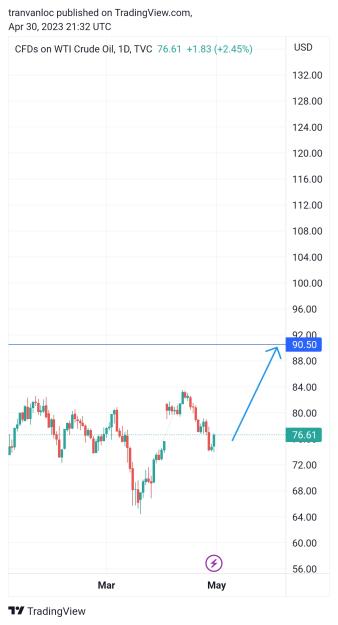
welp...its a saturday so i looked at my charts and oil looks even worse than i thought.
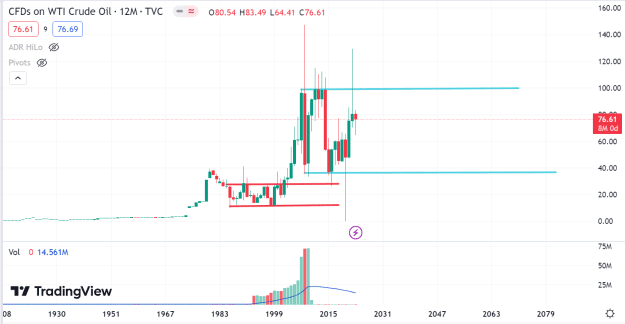
i posted this cfd chart since my cl chart has all kinds of texts and lines i dont want anyone to see LOL..theyre both yearly and they both look the same
as you can see oil has been in a range for 15 years. admittedly it is a big range not like the small one outlined in red that ranged for near 20 years LOL
with the advent of EV vehicles oil is dead...what we see in the blue range is the death throes of the commodity. its like when you pull a fish out of water it thrashes and fights before it dies.
my other point is about XOM...it posted record profits not because oil is surging in price but because theyre gouging people since covid and stock buybacks...i predict and will short some stock and buy puts that XOM will be at 100 by next earnings
Attached Image (click to enlarge)
trade like the 5% contrarians not the 95% losers