• Home
  • Forums
  • News
  • Calendar
  • Market
  • Login
  • Join
  • User/Email: Password:
  • 12:42pm
Menu
  • Forums
  • News
  • Calendar
  • Market
  • Login
  • Join
  • 12:42pm
Sister Sites
  • Metals Mine
  • Crypto Craft
  • Forex Factory

Options

Bookmark Thread

First Page First Unread Last Page Last Post

Print Thread

Similar Threads

Scripts for Limit entry, Stop entry, Market entry 46 replies

Market Profile And Volume Profile MT5 7 replies

MarketProfile/Volume Profile/Auction Market Theory indi? 17 replies

looking for volume profile for 1 min and up 1 reply

Market profile trader-Merged profile 0 replies

  • Interactive Trading
  • /
  • Reply to Thread
  • Subscribe
  • 37
Attachments: Volume Profile, Supply/Demand, entry levels
Exit Attachments
Tags: Volume Profile, Supply/Demand, entry levels
Cancel

Volume Profile, Supply/Demand, entry levels

  • Last Post
  •  
  • Page 1 23 4
  • Page 1 23 4
  •  
  • Post #1
  • Quote
  • First Post: Edited 5:55am Jul 29, 2022 5:03am | Edited 5:55am
  •  _BBKing_
  • Joined Apr 2010 | Status: Today is my first trading day! | 8,238 Posts
Let's start with a standard introduction.

ME
I made my first trade about 20years ago (22btw). It was before the 9/11.
OVer the time I was not trading every single day, and I also left many times with some years away for mhyany reasons. In total let's say I spent 40% of this time in trading and 60% in doing something else.
This, of course, isn't really important since I believe that everyday there is something new happening out there. Experience in trading matters maybe only in better understanding if a market is more likely to go in a direction or in the other, based on many informations.

MY PLATFORM
I trade using JForex (Dukascopy) since many years. Reason is simple: I like the functionality it gives me.
There are many platforms and many other good brokers of course.

MY TRADING
My main difficult in trading was and still is about finding a strategy.
I guess I reached a good level but in the same time I suspect there is still some adjustments required.

I like clean charts.

I personally believe the main thing to do in trading is to know what concerns and instrument. I need to know what the world consider as important news to trade that instrument. So if the world considers important a war to blindly buy OIL no matter what the price, I will probably doing the same otherwise I will be selling somenthing that the whole world keeps buying.

LESSONS LEARNT

1. Market is always right
There is no such a simple and straightforward thing out there in life. Remember.
Market will be moving up and down and what really matters is knowing what is moving an instrument and understanding where are the main important areas where buy or sell.

2. A chart is a visual representation of a market
Reading a chart means reading what are price moves over a period of time. That's it. You can decide to read whatever calculation and trasformation you prefer, but this is not gonna change the meaning of a chart.

3. You guess, you die
Really, I lost thousands $ in following a guess, because of an idea, because of bias. Stop guessing what could happen next, we are nobody to know. Yes... you can guess it right sometimes but that's not what makes the money and worst of all if you keep guessing and following your guess, you will only be able to read what confirms your vision. There are tonnes of studies confirming this. So

4. What matters to me, doesn't really need to matter also to you.
If you pick any chart and show it to 10 person and ask them what would you do, you will probably receive 10 different views. Sometimes it is good if someone has your same view, but that's just chance and doesn't make your idea better indeed you could be both wrong.


Now that introduction is done let's move forward.
Yesterday was the past
  • Post #2
  • Quote
  • Jul 29, 2022 5:22am Jul 29, 2022 5:22am
  •  _BBKing_
  • Joined Apr 2010 | Status: Today is my first trading day! | 8,238 Posts
Let's start with simple things.
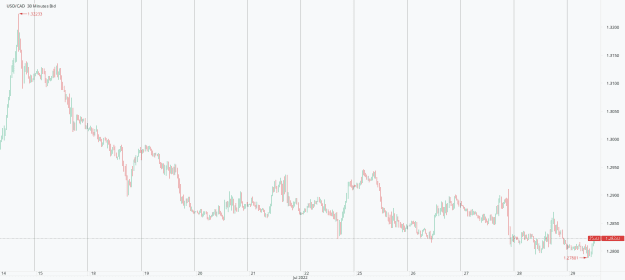
This is USD/CAD last 15days chart:

Attached Image (click to enlarge)
Click to Enlarge

Name: Chart_USD_CAD_30 Mins_snapshot.png
Size: 22 KB

There is clearly a move down from 1.32 to the actual 1.28
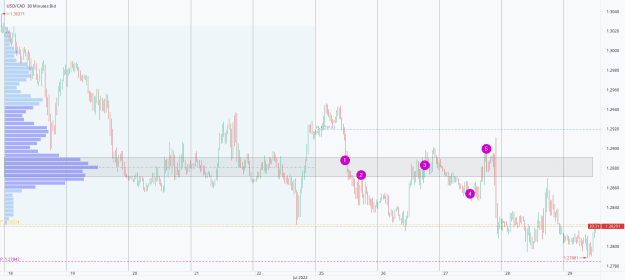
I will use this chart to put inside the first main study (Volume Profile).

Attached Image (click to enlarge)
Click to Enlarge

Name: Chart_USD_CAD_30 Mins_snapshot3.png
Size: 27 KB


In this chart I drawn it to read the whole last week data and what comes out is there is important volume in the area between 1.2870 and 1.2900.
Looking at the chart the area some important clues:
1. Price going through the POC area
2. POC acting as supply (resistance)
3. Price again reaching resistance
4. Price not really moving down
5. Price still in resistance

As you can see, I consider support and resistances as areas.

The question is: can I bring those moves and trade them profitably?

Attached Image (click to enlarge)
Click to Enlarge

Name: Chart_USD_CAD_30 Mins_snapshot4.png
Size: 36 KB

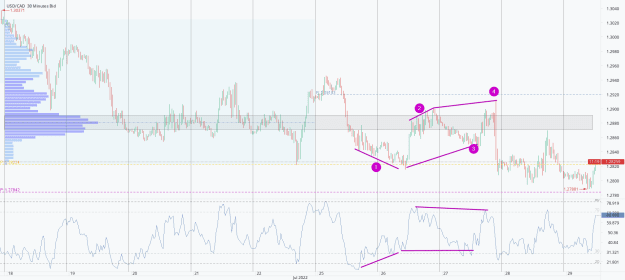
There must be an additional factor. I found it a good one with RSI Divergences.
As you can see in previous chart there were this week 4 or 5 possible trades on both sides short and long.
If there is a good divergence with RSI near important volumes areas, a reaction is more likely to happen.
Yesterday was the past
 
1
  • Post #3
  • Quote
  • Jul 29, 2022 5:41am Jul 29, 2022 5:41am
  •  _BBKing_
  • Joined Apr 2010 | Status: Today is my first trading day! | 8,238 Posts
Let me show better what I read.
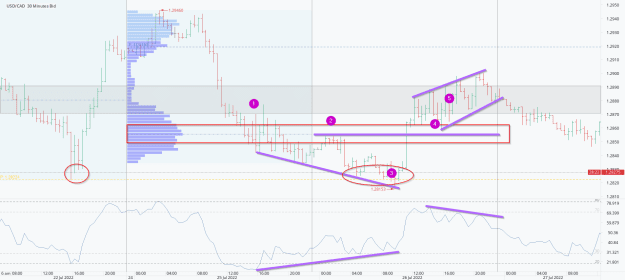
Still about previous example let's see what happened at point 1 and 2

Attached Image (click to enlarge)
Click to Enlarge

Name: Chart_USD_CAD_30 Mins_snapshot5.png
Size: 38 KB

1. So, price broke last week's POC. End of day, slow volatility.
2. Asia session keeps on selling the instrument moving it down to previous low
3. EU session kind of a double bottom near 1.2820 and clear bullish divergence: it's a buy with SL 1.28 and TP 1.2860-70 (approx 60pips)
4. NY session bouncing price above the broken yesterday's POC which now is more likely to be support (demand). It's a buy SL 1.2850 TP 1.29 (approx 30-40pips)
5. End of day, price unable to move higher, rising wedge against resistance (supply prev week POC) and bearish divergence with RSI: it's a clear short with SL 1.2920 target at least 2850

Days like this happens many times. I just picked what happened in that day in this instrument but I could show tens of examples.
Yesterday was the past
 
1
  • Post #4
  • Quote
  • Jul 29, 2022 5:45am Jul 29, 2022 5:45am
  •  _BBKing_
  • Joined Apr 2010 | Status: Today is my first trading day! | 8,238 Posts
I by the way trade mainly in

OIL WTI
US 500
USD/CAD
USD/JPY
GBP/USD

I simply like these instruments and find them good based on my ability to read them.
Yesterday was the past
 
 
  • Post #5
  • Quote
  • Jul 29, 2022 7:42am Jul 29, 2022 7:42am
  •  _BBKing_
  • Joined Apr 2010 | Status: Today is my first trading day! | 8,238 Posts
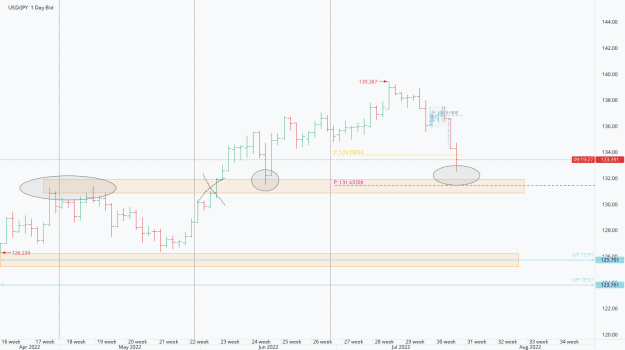
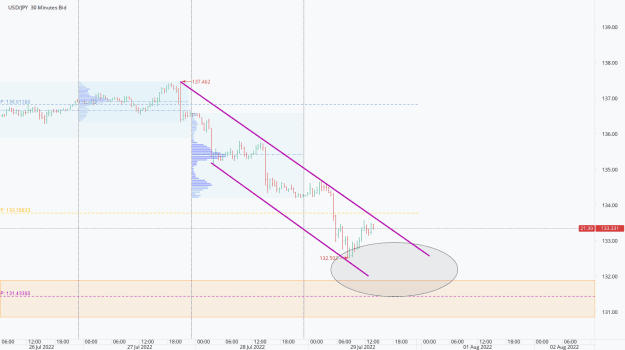
USD/JPY
Approaching important area better seen in daily

Attached Image (click to enlarge)
Click to Enlarge

Name: Chart_USD_JPY_Daily_snapshot.png
Size: 20 KB

At the moment price is not showing important reaction. Not even a reaction btw

Attached Image (click to enlarge)
Click to Enlarge

Name: Chart_USD_JPY_30 Mins_snapshot.png
Size: 21 KB

Will be looking if goes lower to catch some buy opportunities. First good thing would be to see it breaking the hourly channel
Yesterday was the past
 
1
  • Post #6
  • Quote
  • Jul 29, 2022 7:52am Jul 29, 2022 7:52am
  •  _BBKing_
  • Joined Apr 2010 | Status: Today is my first trading day! | 8,238 Posts
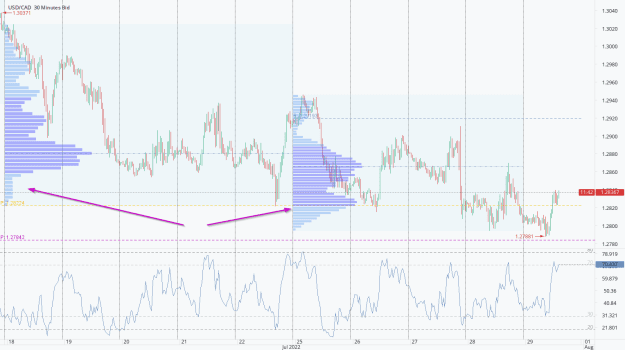
USD/CAD
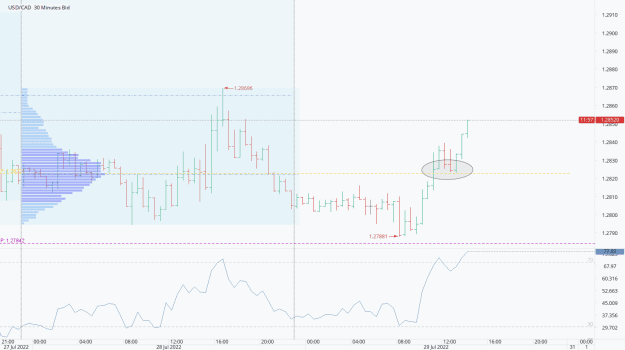
So far volumes shows both last and this week main area is 2860-2880
Interesting increasing volumes near and below the 2800.

Attached Image (click to enlarge)
Click to Enlarge

Name: Chart_USD_CAD_30 Mins_snapshot6.png
Size: 33 KB

Considering USD strength, there could be soon a change in this instrument.
Yesterday was the past
 
2
  • Post #7
  • Quote
  • Jul 29, 2022 7:59am Jul 29, 2022 7:59am
  •  _BBKing_
  • Joined Apr 2010 | Status: Today is my first trading day! | 8,238 Posts
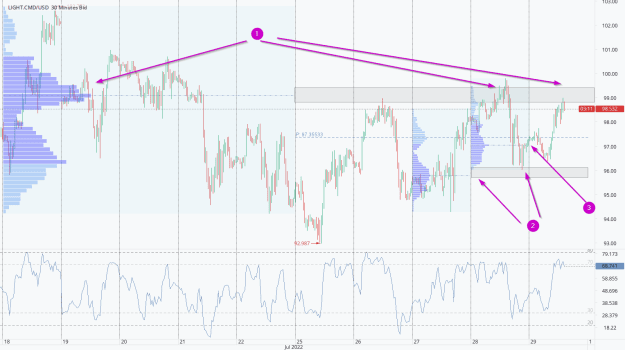
OIL
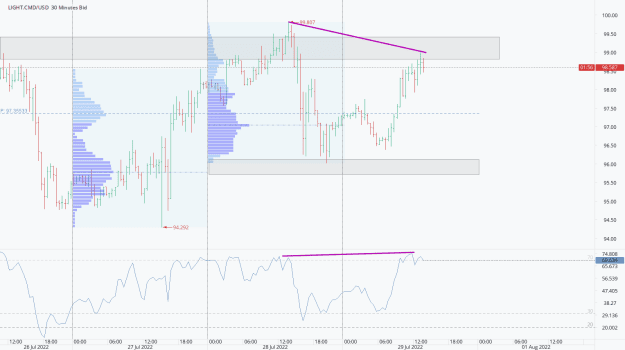
Last week's POC provides important supply atm (1)
Market, for what I see, is boiling something around this area under 100 with important moves (2) + (3) up but also strong moves down. A great mover indeed.

Attached Image (click to enlarge)
Click to Enlarge

Name: Chart_LIGHT.CMD_USD_30 Mins_snapshot.png
Size: 37 KB

looking for how develops this area during NY. There could be entry short

Attached Image (click to enlarge)
Click to Enlarge

Name: Chart_LIGHT.CMD_USD_30 Mins_snapshot2.png
Size: 24 KB
Yesterday was the past
 
1
  • Post #8
  • Quote
  • Jul 29, 2022 8:04am Jul 29, 2022 8:04am
  •  kette
  • Joined Jan 2018 | Status: Member | 15,081 Posts
Quoting _BBKing_
Disliked
USD/CAD So far volumes shows both last and this week main area is 2860-2880 Interesting increasing volumes near and below the 2800. {image} Considering USD strength, there could be soon a change in this instrument.
Ignored

USDCAD
buy via the Asia -poc


nice room
 
 
  • Post #9
  • Quote
  • Jul 29, 2022 8:18am Jul 29, 2022 8:18am
  •  _BBKing_
  • Joined Apr 2010 | Status: Today is my first trading day! | 8,238 Posts
Quoting kette
Disliked
{quote} USDCAD buy via the Asia -poc nice room
Ignored
Thank you

And yes.... I missed this entry was having lunch

Attached Image (click to enlarge)
Click to Enlarge

Name: Chart_USD_CAD_30 Mins_snapshot7.png
Size: 22 KB
Yesterday was the past
 
2
  • Post #10
  • Quote
  • Jul 29, 2022 8:23am Jul 29, 2022 8:23am
  •  kette
  • Joined Jan 2018 | Status: Member | 15,081 Posts
Quoting _BBKing_
Disliked
{quote} Thank you And yes.... I missed this entry was having lunch {image}
Ignored

Never mind, the important thing is that you saw it.
 
 
  • Post #11
  • Quote
  • Jul 29, 2022 8:30am Jul 29, 2022 8:30am
  •  _BBKing_
  • Joined Apr 2010 | Status: Today is my first trading day! | 8,238 Posts
Quoting kette
Disliked
{quote} Never mind, the important thing is that you saw it.
Ignored
Also noticed 2 more things
1. there is already a thread about volume profile... .didn't see it!
2. I don't like a lot sessions' POC. For example today's move in UCad above asia poc 2807

do you trade them and find reliable?
Yesterday was the past
 
1
  • Post #12
  • Quote
  • Jul 29, 2022 8:33am Jul 29, 2022 8:33am
  •  kette
  • Joined Jan 2018 | Status: Member | 15,081 Posts
Quoting _BBKing_
Disliked
{quote} Also noticed 2 more things 1. there is already a thread about volume profile... .didn't see it! 2. I don't like a lot sessions' POC. For example today's move in UCad above asia poc 2807 do you trade them and find reliable?
Ignored

I think your approach and the way you describe it is great.
I will have a look from time to time.
keep it up, everything is right so far.
 
1
  • Post #13
  • Quote
  • Jul 29, 2022 8:40am Jul 29, 2022 8:40am
  •  _BBKing_
  • Joined Apr 2010 | Status: Today is my first trading day! | 8,238 Posts
Thank you
Will check my self also the other thread

EDIT: this was a reply to kette, don't know why the browser set it as new post
Yesterday was the past
 
1
  • Post #14
  • Quote
  • Jul 29, 2022 8:42am Jul 29, 2022 8:42am
  •  _BBKing_
  • Joined Apr 2010 | Status: Today is my first trading day! | 8,238 Posts
US500
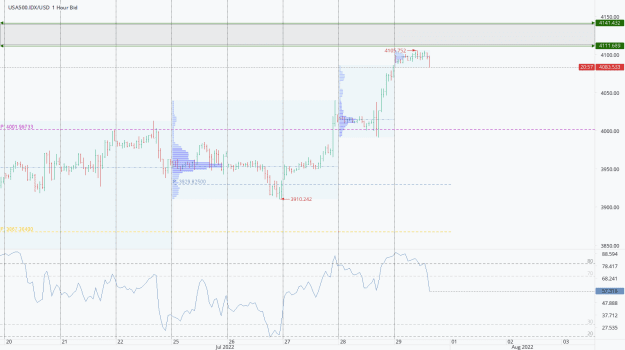
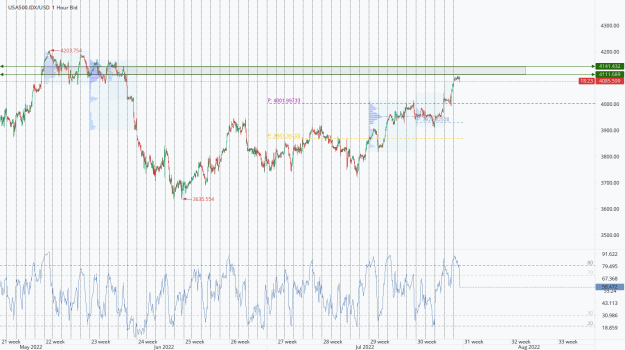
I wonder if can go higher

Attached Image (click to enlarge)
Click to Enlarge

Name: Chart_USA500.IDX_USD_Hourly_snapshot.png
Size: 24 KB

Those 2 lines and gray box come from end of May and June 2022

Attached Image (click to enlarge)
Click to Enlarge

Name: Chart_USA500.IDX_USD_Hourly_snapshot2.png
Size: 37 KB

NY session is moving. Let's see if a trade comes before week and month ends.
Yesterday was the past
 
1
  • Post #15
  • Quote
  • Jul 29, 2022 8:45am Jul 29, 2022 8:45am
  •  _BBKing_
  • Joined Apr 2010 | Status: Today is my first trading day! | 8,238 Posts
Quoting _BBKing_
Disliked
USD/JPY Approaching important area better seen in daily {image} At the moment price is not showing important reaction. Not even a reaction btw {image} Will be looking if goes lower to catch some buy opportunities. First good thing would be to see it breaking the hourly channel
Ignored
First step came. Market broke the hourly channel.
Not yet a good trade setup. Will wait patiently. I have to work on patience.
Yesterday was the past
 
1
  • Post #16
  • Quote
  • Jul 29, 2022 9:10am Jul 29, 2022 9:10am
  •  _BBKing_
  • Joined Apr 2010 | Status: Today is my first trading day! | 8,238 Posts
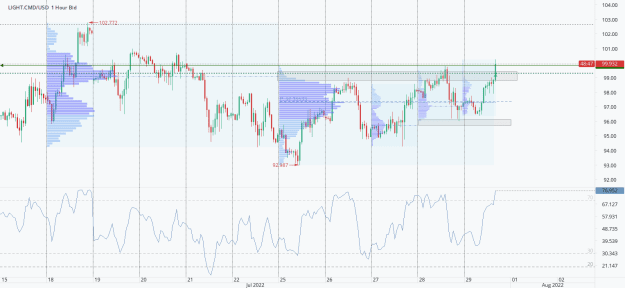
Bought 1contract oil. Bullishness
scary entry 99.25
stop @be already.
should break higher than 100.25 to reach eventually more higher
target atm previous week high.
Attached Image (click to enlarge)
Click to Enlarge

Name: Chart_LIGHT.CMD_USD_Hourly_snapshot.png
Size: 28 KB
Yesterday was the past
 
1
  • Post #17
  • Quote
  • Jul 29, 2022 9:20am Jul 29, 2022 9:20am
  •  _BBKing_
  • Joined Apr 2010 | Status: Today is my first trading day! | 8,238 Posts
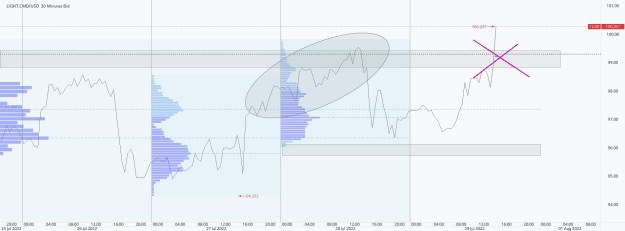
reason why I entered such a scary long in OIL

Price behavior.
Look at the chart... Previous attempts at supply were weak.
Today the move is clearly pushing to break it over and keep moving forward up.
This is just how to perceive markets, no matter what indicators say.
Sometimes it works this way.
Attached Image (click to enlarge)
Click to Enlarge

Name: Chart_LIGHT.CMD_USD_30 Mins_snapshot.png
Size: 26 KB
Yesterday was the past
 
1
  • Post #18
  • Quote
  • Jul 29, 2022 9:35am Jul 29, 2022 9:35am
  •  _BBKing_
  • Joined Apr 2010 | Status: Today is my first trading day! | 8,238 Posts
sl @BE + 4
slippage sometimes in this instrument fills later
even the entry I clicked when price 99.10 but fast move + slippage filled me .15higher
Yesterday was the past
 
 
  • Post #19
  • Quote
  • Jul 29, 2022 10:17am Jul 29, 2022 10:17am
  •  _BBKing_
  • Joined Apr 2010 | Status: Today is my first trading day! | 8,238 Posts
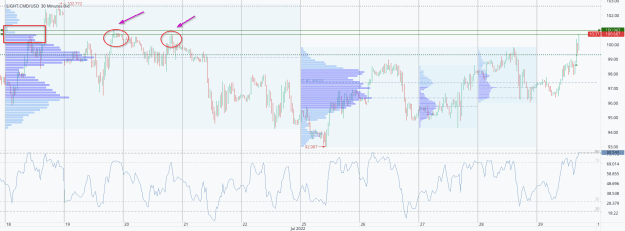
OIL
100.60 till 101 important supply could come and stop it
Attached Image (click to enlarge)
Click to Enlarge

Name: Chart_LIGHT.CMD_USD_30 Mins_snapshot.png
Size: 35 KB
Yesterday was the past
 
1
  • Post #20
  • Quote
  • Jul 29, 2022 10:24am Jul 29, 2022 10:24am
  •  _BBKing_
  • Joined Apr 2010 | Status: Today is my first trading day! | 8,238 Posts
Quoting _BBKing_
Disliked
OIL 100.60 till 101 important supply could come and stop it {image}
Ignored
That GAP seen in the chart above is nothing more than my broker switching from one contract expiry to another
Yesterday was the past
 
 
  • Interactive Trading
  • /
  • Volume Profile, Supply/Demand, entry levels
  • Reply to Thread
    • Page 1 23 4
    • Page 1 23 4
0 traders viewing now
  • More
Top of Page
  • Facebook
  • Twitter
About EE
  • Mission
  • Products
  • User Guide
  • Blog
  • Contact
EE Products
  • Forums
  • Calendar
  • News
  • Market
EE Website
  • Homepage
  • Search
  • Members
  • Report a Bug
Follow EE
  • Facebook
  • Twitter

EE Sister Sites:

  • Metals Mine
  • Crypto Craft
  • Forex Factory

Energy EXCH™ is a brand of Fair Economy, Inc.

Terms of Service / ©2023