Forex Factory
  • Home
  • Forums
  • News
  • Calendar
  • Market
  • Login
  • User/Email: Password:
  • 4:47pm
  • Search
Menu
  • Forums
  • News
  • Calendar
  • Market
  • Login
  • 4:47pm
Search

Options

Search
Search
Search

Bookmark Thread

First Page First Unread Last Page Last Post

Printable Version

You are viewing
the Energy EXCH
beta version.

Your participation
is appreciated!

Similar Threads

Algorithmic Quant Trading (Machine Learning + Stat-Arb) 25 replies

Machine Learning + Retail Forex = Profitable? (Quant) 1 reply

Potential new machine learning style software. 79 replies

My most recent advancements into machine learning 16 replies

  • Trading Discussion
  • /
  • Reply to Thread
  • Subscribe
  • 230
Attachments: Machine Learning with algoTraderJo
Exit Attachments

Machine Learning with algoTraderJo

  • Last Post
  •  
  • Page 1 23456 47
  • Page 1 234 47
  •  
  • Post #1
  • Quote
  • First Post: Dec 8, 2014 7:51am Dec 8, 2014 7:51am
  •  algoTraderJo
  • Joined Dec 2014 | Status: Member | 412 Posts
Hello fellow traders,

I am starting this thread hoping to share with you some of my developments in the field of machine learning. Although I may not share with you exact systems or coding implementations (don't expect to get anything to "plug-and-play" and get rich from this thread) I will share with you ideas, results of my experiment and possibly other aspects of my work. I am starting this thread in the hopes that we will be able to share ideas and help each other improve our implementations. I will start with some simple machine learning strategies and will then go into more complex stuff as time goes by. Hope you enjoy the ride!

algoTraderJo
  • Post #2
  • Quote
  • Dec 8, 2014 7:54am Dec 8, 2014 7:54am
  •  kprsa
  • Joined Feb 2014 | Status: ember | 1,255 Posts
Subscribed!
Thank you,
k
  • Post #3
  • Quote
  • Dec 8, 2014 8:01am Dec 8, 2014 8:01am
  •  PipMeUp
  • Joined Aug 2011 | Status: Member | 1,296 Posts
Subscribed too.
No greed. No fear. Just maths.
  • Post #4
  • Quote
  • Dec 8, 2014 8:25am Dec 8, 2014 8:25am
  •  algoTraderJo
  • Joined Dec 2014 | Status: Member | 412 Posts
Glad to hear some of you have already subscribed! I hope to make things interesting for you
  • Post #5
  • Quote
  • Dec 8, 2014 8:36am Dec 8, 2014 8:36am
  •  algoTraderJo
  • Joined Dec 2014 | Status: Member | 412 Posts
I want to start by saying some basic things. I am sorry if the structure of my posts leaves a lot to be desired, I don't have any forum posting experience but hope to get some with time.

In machine learning what we want to do is simply to generate a prediction that is useful for our trading. To make this prediction we generate a statistical model using a set of examples (known outputs and some inputs we things have predictive power to predict those outputs) we then make a prediction of an unknown output (our recent data) using the model we created with the examples.

To sum it up it is a "simple" process where we do the following:

  1. Select what we want to predict (this will be our target(s))
  2. Select some input variables that we think can predict our targets
  3. Build a set of examples using past data with our inputs and our targets
  4. Create a model using these examples. A model is simply a mathematical mechanism that relates the inputs/targets
  5. Make a prediction of the target using the last known inputs
  6. Trade using this information

I want to say from the start that it is very important to avoid doing what many academic papers on machine learning do, which is to attempt to build a model with very large arrays of examples and then attempt to make a long term prediction on an "out-of-sample" set. Building a model with 10 years of data and then testing it on the last two is non-sense, subject to many types of statistical biases we will discuss later on.

In general you will see that the machine learning models I build are trained on every bar (or every time I need to make a decision) using a moving window of data for the building of examples (only recent examples are considered relevant). Sure, this approach is no stranger to some types of statistical biases but we remove the "elephant in the room" when using the broad in-sample|out-of-sample approach of most academic papers (which, no surprise, often leads to approaches that are not actually useful to trade).

There are mainly three things to concern yourself with when building a machine learning model:

  1. What to predict (what target)
  2. What to predict it with (which inputs)
  3. How to relate the target and inputs (what model)

Most of what I will be mentioning on this thread will focus on answering these questions, with actual examples. If you want write any questions you might have and I will attempt to give you an answer or simply let you know if I will answer that later on.

2
  • Post #6
  • Quote
  • Dec 8, 2014 10:19am Dec 8, 2014 10:19am
  •  algoTraderJo
  • Joined Dec 2014 | Status: Member | 412 Posts
Let us get down to business now. A real practical example using machine learning. Let's suppose we want to build a very simple model using a very simple set of inputs/targets. For this experiment these are the answers to the questions:

  1. What to predict (what target) -> The direction of the next day (bullish or bearish)
  2. What to predict it with (which inputs) -> The direction of the previous 2 days
  3. How to relate the target and inputs (what model) -> A linear map classifier

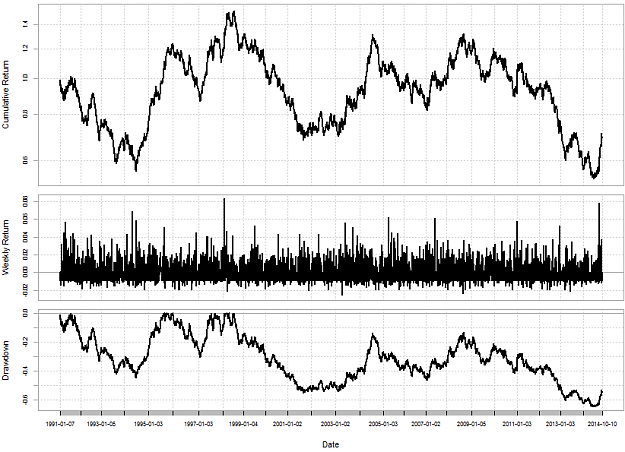
This model will attempt to predict the directionality of the next daily bar. To build our model we take the past 200 examples (a day's direction as target and the previous two day directions as inputs) and we train a linear classifier. We do this at the start of every daily bar. If we have an example where two bullish days lead to a bearish day the inputs would be 1,1 and the target would be 0 (0=bearish, 1=bullish), we use 200 of these examples to train the model on each bar. We hope to be able to build a relationship where the direction of two days yields some above-random probability to predict the day's direction correctly. We use a stoploss equal to 50% of the 20 day period Average True Range on every trade.

Attached Image (click to enlarge)
Click to Enlarge

Name: machinelearning_linearmap-sample.png
Size: 27 KB


A simulation of this technique from 1988 to 2014 on the EUR/USD (data before 1999 is DEM/USD) above shows that the model has no stable profit generation. In fact this model follows a negatively biased random walk, which makes it lose money as a function of the spread (3 pips in my sim). Look at the apparently "impressive" performance we have in 1993-1995 and in 2003-2005, where apparently we could successfully predict the next day's directionality using a simple linear model and the past two day directional outcomes.

This example shows you several important things. For example, that across short timescales (which could be a couple of years) you can be easily fooled by randomness --- you can think you have something that works which really does not. Remember that the model is rebuilt on every bar, using the past 200 input/target examples. What other things do you think you can learn from this example? Post your thoughts!
1
  • Post #7
  • Quote
  • Dec 8, 2014 10:45am Dec 8, 2014 10:45am
  •  algoTraderJo
  • Joined Dec 2014 | Status: Member | 412 Posts
It's interesting to think about what might be wrong in the above example:

  1. Did we choose the wrong model? (the relationship is too complex for our model to make out)
  2. Did we choose the wrong inputs? (the inputs have no relationship with the targets, no predictive power)
  3. Are our predictions of enough value ? (is predicting the target accurately good enough to be profitable? Does the value of predicting the target change?)
  4. Are we using the right number of examples to build our model? (do we need to add more examples for training or are we using too many?)

  • Post #8
  • Quote
  • Dec 8, 2014 11:35am Dec 8, 2014 11:35am
  •  algoTraderJo
  • Joined Dec 2014 | Status: Member | 412 Posts
The above generates the more interesting how questions:

  1. How do we know that an input has predictive power?
  2. How do we distinguish profitable results from the results our machine learning model can give due to random chance? (how to measure data mining bias?)
  3. How do we know how many examples to use?

  • Post #9
  • Quote
  • Dec 8, 2014 11:52am Dec 8, 2014 11:52am
  •  ARTjoMS
  • | Joined Sep 2012 | Status: Member | 129 Posts
Quote
Disliked
the inputs have no relationship with the targets, no predictive power
To me it is pretty obvious that if there is an edge in such relationship then it must be microscopic.

Quote
Disliked
is predicting the target accurately good enough to be profitable? Does the value of predicting the target change?
This is also an issue.

Here is my example which I have thought about previously: Suppose you have observed that price often tends to retrace at some kind of level and now you have decided to backtest to see if you were right.

I have not done such backtests myself, but to me it is intuitively obvious that If you tried to backtest this with large SL/TP, e.g. 100 pips up and down - what you should get is very small edge that is very unlikely to offset trading costs.

It is important to understand the limit of your analysis. Well... so you predicted that buyers or sellers would step in. Hmm, but what exactly it has to do with price going up or down 100 pips? Price can react in various ways - it might just tank for some time (while all limit orders are filled) and then keep moving further. It can also retrace 5, 10, 50 or even 99 pips. In all of these cases you were kinda right about buyers or sellers stepping in, but you must understand that this analysis doesn't have much to do with your trade going from +90pip to +100pip .
  • Post #10
  • Quote
  • Dec 8, 2014 12:01pm Dec 8, 2014 12:01pm
  •  algoTraderJo
  • Joined Dec 2014 | Status: Member | 412 Posts
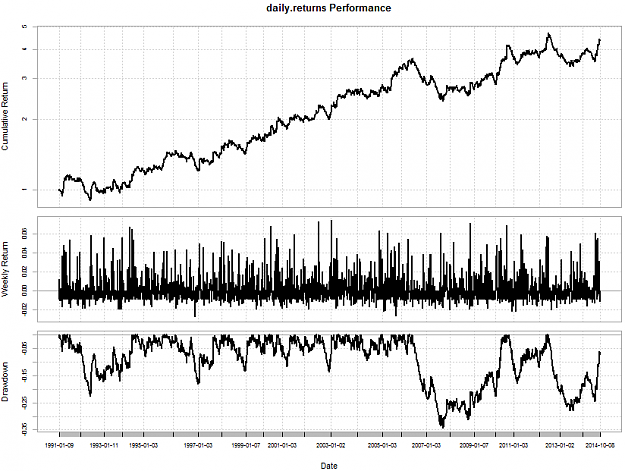
Consider now that we change the model to a still simple yet more powerful classifier (a K-Nearest Neighbor approach) using the same input/target structure as above (two past days to predict next day's directionality). However we now have a stoploss of 70% of the Average True Range (risking 1% per trade) and we train using 70 instead of 200 examples. We still rebuild the model on each daily bar. See how our balance curve changes drastically:

Attached Image (click to enlarge)
Click to Enlarge

Name: machinelearning_k-nn-sample.png
Size: 29 KB


We now have something that works much better, with a correlation coefficient of 0.95 on the log(balance) Vs Time. However the question still arises. How do we know the probability that this result is just due to random chance? (our model fitting nothing but noise and giving this result spuriously?). What do you think is the effect of changing the number of examples?
  • Post #11
  • Quote
  • Dec 8, 2014 12:05pm Dec 8, 2014 12:05pm
  •  algoTraderJo
  • Joined Dec 2014 | Status: Member | 412 Posts
Quoting ARTjoMS
Disliked
{quote}Well... so you predicted that buyers or sellers would step in. Hmm, but what exactly it has to do with price going up or down 100 pips? Price can react in various ways - it might just tank for some time (while all limit orders are filled) and then keep moving further. It can also retrace 5, 10, 50 or even 99 pips. In all of these cases you were kinda right about buyers or sellers stepping in, but you must understand that this analysis doesn't have much to do with your trade going from +90pip to +100pip .
Ignored
Yes, you're right! This is a big part of the reason why we are getting poor results when using the linear mapping algorithm. Because our profitability is poorly related with our prediction. Predicting that days are bullish/bearish is of limited use if you don't know how much price will move. Perhaps your predictions are correct only on days that give you 10 pips and you get all the days that have +100 pip directionality totally wrong. What would you consider a better target for a machine learning method?
  • Post #12
  • Quote
  • Dec 8, 2014 12:13pm Dec 8, 2014 12:13pm
  •  GoldTheHun
  • Joined Nov 2014 | Status: Member | 382 Posts
Subscribed and wish you good luck on your journey
  • Post #13
  • Quote
  • Dec 8, 2014 12:19pm Dec 8, 2014 12:19pm
  •  PipMeUp
  • Joined Aug 2011 | Status: Member | 1,296 Posts
Quoting algoTraderJo
Disliked
What would you consider a better target for a machine learning method?
Ignored
An histogram (empirical probabilities) of the move of the price from the current price. So I can get a target, a stop, a probability of this move. This give the direction, the TP, the SL and the risk to put on this trade (Kelly = expectancy / RR)
No greed. No fear. Just maths.
  • Post #14
  • Quote
  • Dec 8, 2014 12:19pm Dec 8, 2014 12:19pm
  •  GoldTheHun
  • Joined Nov 2014 | Status: Member | 382 Posts
Quoting algoTraderJo
Disliked
{quote} Yes, you're right! This is a big part of the reason why we are getting poor results when using the linear mapping algorithm. Because our profitability is poorly related with our prediction. Predicting that days are bullish/bearish is of limited use if you don't know how much price will move. Perhaps your predictions are correct only on days that give you 10 pips and you get all the days that have +100 pip directionality totally wrong. What would you consider a better target for a machine learning method?
Ignored

Lets say if you have 100 pip TP and SL, I would want to predict which comes first: TP or SL
Example:
TP came first +1
SL came first 0 (or -1, however you map it)
  • Post #15
  • Quote
  • Dec 8, 2014 12:20pm Dec 8, 2014 12:20pm
  •  PipMeUp
  • Joined Aug 2011 | Status: Member | 1,296 Posts
Too bad the mode of the histogram will be exactly on the current price
No greed. No fear. Just maths.
  • Post #16
  • Quote
  • Dec 8, 2014 12:23pm Dec 8, 2014 12:23pm
  •  GoldTheHun
  • Joined Nov 2014 | Status: Member | 382 Posts
This model that I mentioned: if TP comes first =+1, if SL comes first =0, could also be modeled using logistic regression, but with what predictor variables ? I personally don't know
  • Post #17
  • Quote
  • Dec 8, 2014 1:58pm Dec 8, 2014 1:58pm
  •  ARTjoMS
  • | Joined Sep 2012 | Status: Member | 129 Posts
Quoting algoTraderJo
Disliked
{quote}What would you consider a better target for a machine learning method?
Ignored
If the goal is to estimate predictability power of the input (or compare with other inputs) then analysis of multivariate histograms (various SL/various TP) intuitively makes sense to me.

However, if you mean this:

Quote
Disliked

  1. Select what we want to predict (this will be our target(s))


then I think I would approach this differently. Do you know how chess engines work?

Chess engines are programs that analyse chess positions and gives assessment of the position, -0.25 to +0.25 means the position is around equal, +0.25 to +0.5 means that white is slightly better (likewise -0.25 to -0.5 means black is slightly better), +1 represents that white has an advantage of something around one pawn.
More than 1.5 advanatge usually means that side is basically winning with perfect play by leading side.

One might try something similar here ... trying to assess how good a buy or sell is. And if the assessment at some point in time happens to go clearly in favour of one side.... then it might work as a trigger to opan a position. And when it gets back to zero you might as well exit, because you probably don't have an edge anymore.

What probably makes trading case more difficult is inputs - there are plenty of them, they are harder to assess and many of them are also hard to turn into code.

BTW, I am not sure if machine learning is involved in best chess engines. Inputs and their assessemts might be only human made.
  • Post #18
  • Quote
  • Dec 8, 2014 5:05pm Dec 8, 2014 5:05pm
  •  Sasco_me
  • Joined Apr 2007 | Status: (! UseStopLoss == ! Win ) | 181 Posts
Subscribed
Appreciate your effort
Thank You
I'm not a programmer and i don't like ! , but only I try to catch my view !
  • Post #19
  • Quote
  • Dec 8, 2014 5:18pm Dec 8, 2014 5:18pm
  •  Sasco_me
  • Joined Apr 2007 | Status: (! UseStopLoss == ! Win ) | 181 Posts
I think if we know next candle either bullish or bearish with high probability we can build a thousand of successful strategy
as we know the first step and the last step with high probability
go a head my friend algotraderjo ...
I'm not a programmer and i don't like ! , but only I try to catch my view !
  • Post #20
  • Quote
  • Dec 8, 2014 5:29pm Dec 8, 2014 5:29pm
  •  Soros
  • Joined Sep 2012 | Status: Member | 921 Posts
wow!!!!!!!!

subscribed!

where do you get the technology to conduct these tests and modules?
I am what Many Dream to be but only a few can achieve, im a part of the 1%
Thread Tools Search this Thread
Show Printable Version Show Printable Version
Email This Thread Email This Thread
Search this Thread:

Advanced Search

  • Trading Discussion
  • /
  • Machine Learning with algoTraderJo
  • Reply to Thread
    • Page 1 23456 47
    • Page 1 234 47
0 traders viewing now
  • More
Top of Page

You are viewing
the Energy EXCH
beta version.

Your participation
is appreciated!

You are viewing
the Energy EXCH
beta version.

Your participation
is appreciated!

  • Facebook
  • Twitter
EE Website
  • Homepage
  • Search
  • Members
  • User Guide
  • Report a Bug
EE Products
  • Forums
  • Calendar
  • News
  • Market
About EE
  • Mission
  • Products
  • Blog
  • Contact
Follow EE
  • Facebook
  • Twitter

Other Markets:

  • Forex Factory
  • Crypto Craft
  • Metals Mine

Energy EXCH™ is a brand of Fair Economy, Inc.

Terms of Service / ©2019