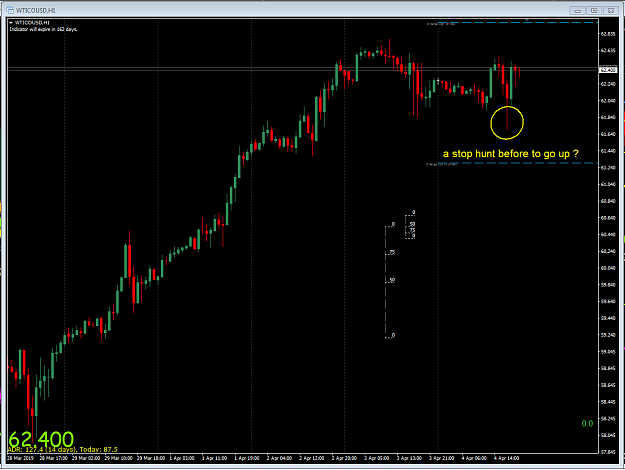
No matter what, someone (or team) doesn't want this to go down at all (even for correction) This is not a healthy market move and it's not base on trades. So we can't explain it by technical analysis. For time being I stay away until I close all my positions with break even.
Ignored
Maybe this weird market behaviour (for WTI) could in some way be linked to the Saudi project to quote Aramco and the recent (first for them) bond emission.
The inventories build up that came out testerday had no effect on price action
Well done, would like to get excited a fall could be coming but the gaps in the 1M may well come back to haunt, D
EDIT
Would like to think my theory was right in previous posts!!!
I don't need to be good at the game, only good enough to beat my opponent,
{quote} Well done, would like to get excited a fall could be coming but the gaps in the 1M may well come back to haunt, D EDIT Would like to think my theory was right in previous posts!!!
Ignored
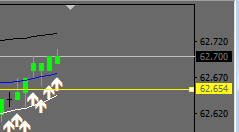
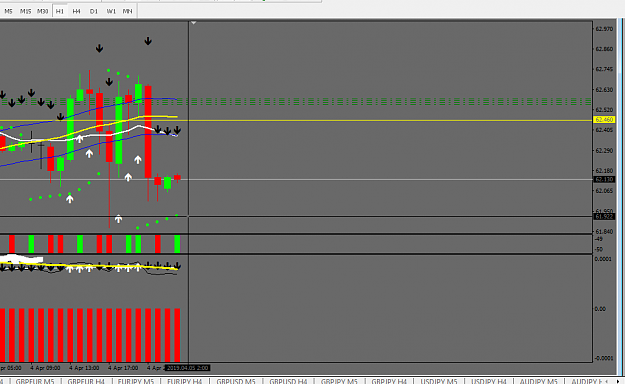
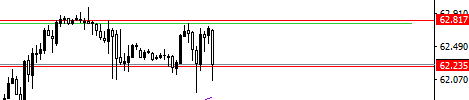
Thnx! WTI is to choppy for me right now no clear direction. Although one could play the range between 62.8 and 62.2
Attached Image
persistence and determination alone are omnipotent
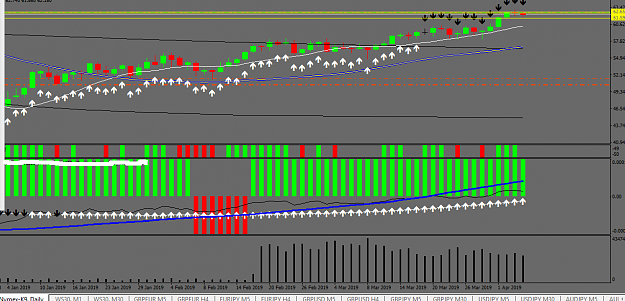
Based on what I would like to see here I think aariapoor has a point, I see the bear still ongoing, just a desparate attempt at a market, while technical may align, sentiment never does.
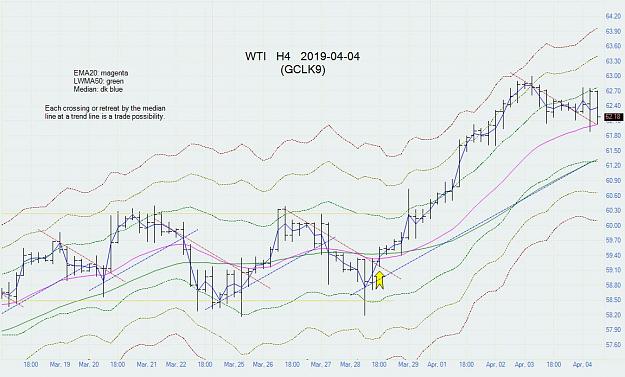
The black line has broken under the blue, in past times it has led the trend direction ( blue still needs to change colour to confirm), buying zones are green but still to turn red, just need selling pressure to emerge, (red bar in the middle), make of it what you will no advice intended, D
Edit
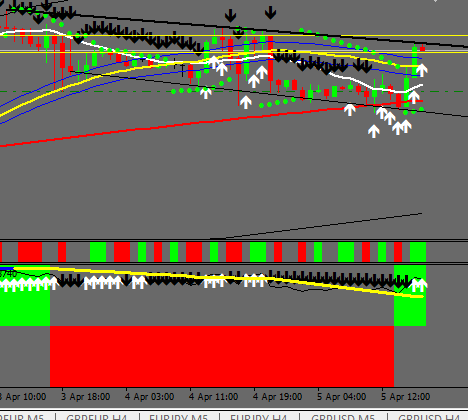
Given what was though it may still not be over, a small battle victory in a bigger war, the masses can change any situation quickly, as can the MM lol, D
Attached Image (click to enlarge)
I don't need to be good at the game, only good enough to beat my opponent,
WTI MEETS A KEY TECHNICAL THRESHOLD AND SULKS JUST BELOW 63 HANDLE
4 April 2019, 22:04
Following a dip in yesterday's trade, sparked by an unexpected build in U.S. crude inventories, West Texas Intermediate crude remains under pressure on a techncial basis, although fundamentals lean bullish.
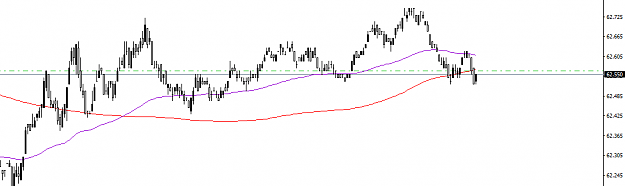
WTI is currently trading at $62.21bbls and has travelled in a range of between $61.91bbls and $62.75bbls, spot.
The price of oil is at a crossroads on a techncial basis with momentum indicators leaning bearish while fundamentals continue to support a bullish argument which brings the 70 handle into the picture - at least that futures price action is pointing towards, on track for the fourth gain in the past five sessions and to roughly five-month highs as markets speculate on a positive outcome between Sino/US trade talks taking place in Washington this week, with an anticipated deal and closure to lengthy trade dispute between the two largest conomies in the world
However, an unexpected rise in U.S. crude inventories with the Energy Information Administration saying that crude inventories rose 7.2 million barrels to 449.5 million barrels in the week ended March 29, leaving them at the five-year average helped to cap prices considering the consensus forecast was for a drop of 100,000 barrels. That, coupled with a bearish technical argument, prices are struggling to get over the line, being the 63 handle ahead of a techncial Fibo target.
WTI levels
Daily stochastics remains overbought and 4HR momentum has extended lower with the price unable to get over the line, being the 63 handle with the 61.8% Fibo as a key target in the 63.70s, meeting Jan 2018 support. Bears could well be inclined to push from here back towards a test of the 200-DMA, and if this does not hold, bulls could well be trapped in a long squeeze to cloud support and the rising wedge's support line. A break of the support line and below $57.80 opens the case for a continuation of the bear trend that would target below the $42 handle and late Dec lows.
persistence and determination alone are omnipotent
WTI MEETS A KEY TECHNICAL THRESHOLD AND SULKS JUST BELOW 63 HANDLE 4 April 2019, 22:04 Following a dip in yesterday's trade, sparked by an unexpected build in U.S. crude inventories, West Texas Intermediate crude remains under pressure on a techncial basis, although fundamentals lean bullish. WTI is currently trading at $62.21bbls and has travelled in a range of between $61.91bbls and $62.75bbls, spot. The price of oil is at a crossroads on a techncial basis with momentum indicators leaning bearish while fundamentals continue to support a bullish...
Ignored
From a trading point all points lower, think the trade deals were the catalyst, but Trump is against high oil prices, that's if his last "Tweet" was anything to go by, just my thoughts, D
I don't need to be good at the game, only good enough to beat my opponent,
{quote} Hello timingchain, could you please share the slope of your trend lines, I tried the +/-36.9 as per Ata thread but seems it is a different gradient from the ones in your chart. many thanks v I believe I have found the mistake I was doing. The copy of the original TL with slope keeps the slope always fixed meanwhile the copy of the TL changes the gradient of the slope when the chart is streched. Sorry Many thanks again v
Ignored
I don't use a specific slope value. I try slopes that fit some trends well, then stick with them until they don't work well, then try again. They work well on the H4, but don't look good on other time frames.
When the contract changes, I have to slide the lines around to the new anchor points, but last time I did not have to change the actual slope of the lines.
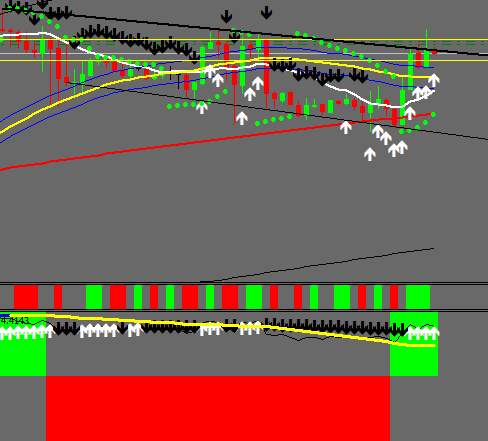
One can only but trade what you see, there may be a glimmer for the bears, but the bull thinking the same way, get out the way I say and give someone else a chance LOL, D
EDIT,
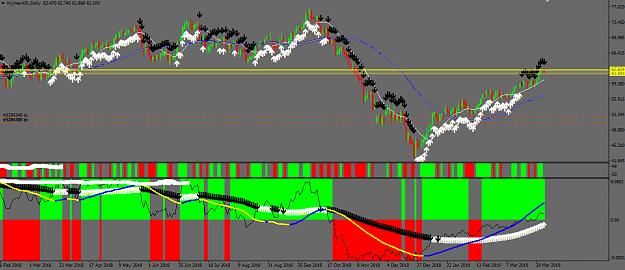
Closed out my mega sell, still holding out of curiosity, and a little luck, D
Stopped out but re-entered, still not convinced the hourly has changed, trend still down,main trend line still yellow, the recent move hasn't moved to blue, anyhow a small punt that could still prove me wrong, just trading what I see as opposed to rumour
Attached Images
I don't need to be good at the game, only good enough to beat my opponent,
UNITED STATES BAKER HUGHES US OIL RIG COUNT: 831 VS 816
Ignored
Think I was just postponing the inevitable, maybe this was what the wait was for but we knew this days ago, it was worth the risk, don't think a huge rise can be sustained, all being built on seems to be in sand, the higher the tower the further to fall,just my opinion, good trading and good weekend all,D
I don't need to be good at the game, only good enough to beat my opponent,