WTI WEAKER ON TRUMP, BOUNCES OFF LOWS NEAR $58.00
28 March 2019, 17:08
Prices of WTI remain on the defensive above the $58.00 mark.
EIA reported a higher than expected build during last week.
Trump once again said prices are too high.
Prices of the barrel of WTI are extending the downbeat mood in the second half of the week although the decline seems to have found decent support in the $58.00 neighbourhood for the time being.
WTI weaker of Trump criticized OPEC
WTI accelerated the daily correction lower after President Trump criticized once again the OPEC’s policy of higher crude oil prices, noting that the cartel should increase the production because oil prices are ‘too high’.
Prices of the barrel of the American reference for the sweet light crude oil came under downside pressure this week after the EIA reported an unexpected build of 2.8M barrels during last week, prompting prices to recede further after recording 2019 tops beyond the $60.00 mark on Tuesday.
In addition, crude oil is deriving extra selling pressure after news said Russia could struggle to join the rest of oil producer on an extension of the current agreement to curb production.
Moving forward, driller Baker Hughes will publish its weekly report on US oil rig count on Friday.
What to look for around WTI
Crude oil has managed to advance further north of the critical $60.00 mark per barrel earlier in the week, clinching at the same time fresh yearly highs in levels last seen in November 2018. Following the up move, the underlying bullish view in crude oil remains well in place on the back of the so-called ‘Saudi put’, tight conditions in the US markets (amidst US net imports in historic low levels and the rising activity in refiners ahead of the summer session), the current OPEC+ agreement to cut oil output and ongoing US sanctions against Iranian and Venezuelan crude oil exports. In addition, speculative longs continue to flow into the markets, reversing the downside that prevailed in late 2018. Further out, the OPEC+ could announce an extension of the current agreement to curb oil production at the cartel’s meeting in June.
WTI significant levels
At the moment the barrel of WTI is down 0.88% at $58.63 and faces the next support at $57.91 (low Mar.25) seconded by $57.80 (21-day SMA) and finally $54.37 (low Mar.8). On the upside, a breakout of $60.11 (2019 high Mar.26) would open the door for $61.67 (200-day SMA) and then $63.74 (61.8% Fibo of the October-December drop).
persistence and determination alone are omnipotent
{quote} I am scaling in this area (58.40 down to 57.50 - rising daily trendline) to accumulate long position. TP around 60.00
Ignored
I am gonna close this position before days end since it is up over 100 pips and will pick it up after it comes back at 6pm EST if i see it going up again. Otherwise I pay through the nose with swaps
{quote} I am gonna close this position before days end since it is up over 100 pips and will pick it up after it comes back at 6pm EST if i see it going up again. Otherwise I pay through the nose with swaps
Ignored
nice trade champ!! profit=profit
persistence and determination alone are omnipotent
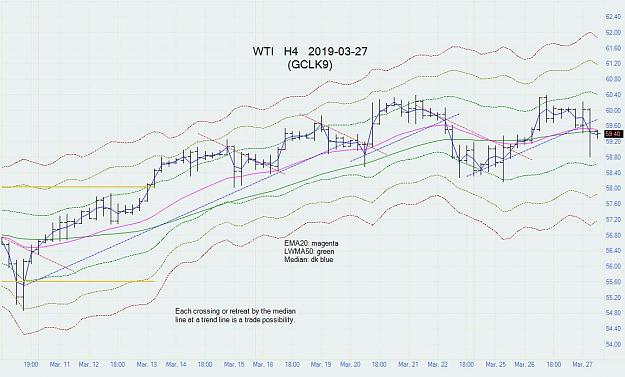
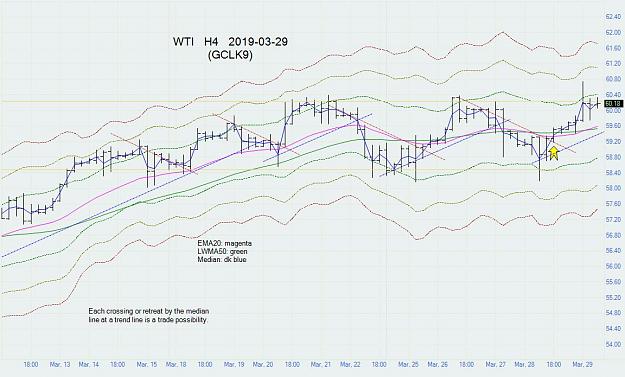
WTI continues range bound since mid March. My high and low lines are based on median prices.
Today saw a reversal through the current downtrend and the EMA20 lines, coming off of a low of 58.20 for the April contract. This double breach suggests a strong run is possible. The way looks clear for an advance beyond 60. This could be influenced by what happens next with US equities.
This weekend, I will post some explanation of the charts I have been showing. Everyone is welcome to attend. Hotdog & beer: 5 cents, just like before the Fed gained control of the USD.
{quote} I am gonna close this position before days end since it is up over 100 pips and will pick it up after it comes back at 6pm EST if i see it going up again. Otherwise I pay through the nose with swaps
WTI: BUYERS AGAIN AIM FOR $60.00 AMID SUPPLY CRUNCH SCENARIO
29 March 2019, 04:04
Energy buyers gave little importance to Trump’s tweet amid optimism surrounding the US-China trade deal and challenges for Venezuelan output.
Russian exit from OPEC+ could hit the bulls to confirm rising wedge and trigger the WTI’s fresh downturn.
WTI trades near $59.50 during early Friday. The energy benchmark earlier dropped on the US President Donald Trump’s tweet pushing OPEC towards supply increase but later on recovered. The recent rally in prices during early Asian session seems to be on the report from Reuters mentioning that the US orders foreign firms to further cut imports from Venezuela. Traders may now concentrate on Baker Hughes US oil rig count together with developments from the Beijing as the US delegates are on a two-day visit to China for trade negotiation.
During late-Thursday the quote slipped to near $58.00 after Trump tweeted that "Very important that OPEC increase the flow of Oil. World Markets are fragile, the price of Oil getting too high.” However, prices gradually recovered afterward as traders might have recollected that the Organization of the Petroleum Exporting Countries (OPEC) has previously ignored Trump’s push for supply boost.
On the supply side, Venezuela is already witnessing difficulties producing and selling its energy products as a power outage at home and stiff sanctions from the US play their role. A recent news report from Reuters signal further hardships for an OPEC member and decline in the cartel’s output as well.
While catalysts concerning Venezuela and likely progress at the US-China trade deal are supporting recent price uplift, doubts over Russia’s part in future OPEC+ supply cuts may weigh on the crude’s upside.
The weekly release of Baker Hughes US oil rig counts seems an important supply indicator for energy traders to watch. There has been a steady downside in the US oil rig counts since the last few weeks, signaling supply cuts. In its recent release, the rig count stat stood at 824 during the week ended on March 22, down from 833 earlier.
WTI Technical Analysis
FXStreet Analyst Ross J Burland expects WTI sellers to take control on rising wedge break. His analysis says:
“WTI Daily chart shows bearish stochastic, rising bearish wedge, 38.2% Fibo target if 58 bear trap support broken, daily cloud support confluence and 1200 point target to $47 handle. On the flipside, bulls can target 61.8% Fibo and 63 handle.”
persistence and determination alone are omnipotent
So I did a short a while ago, and managed to only make a few dollars, no big home run. Looking like Oil is going to at least $62. There is a inverse Head and Shoulder pattern on the hour chart and it targets $62 and change. Next short will be between 62-63 area. Best trading all!
Ignored
Curious if resistance will break
Attached Image
persistence and determination alone are omnipotent
... double breach suggests a strong run is possible. The way looks clear for an advance beyond 60... {image}
Ignored
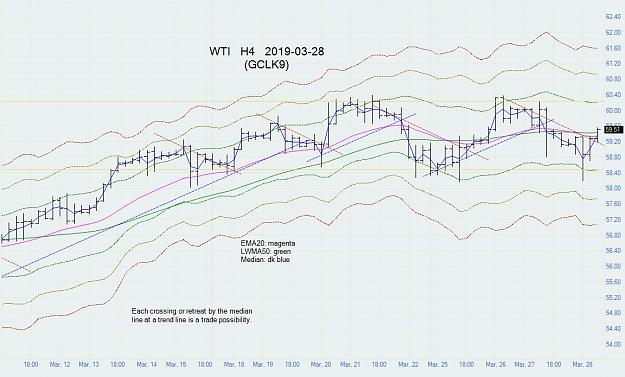
End of week update: WTI April contract, H4 chart:
The median crossed downtrend line (red) at ~58.28 on Thursday (arrow)
It reached a high of 60.73 on Friday, ~40 pips beyond Ll1979's resistance line before falling back.
There was a max potential gain of ~240 pips following the breach on Thursday.
The contract closed the week at 60.18.
The high was a pin spike. The median line remains at the top of its trading range since mid-March
As I shared with members of my channel, Im still going to try to swing the oil till 75. Saudis need it to be at least 80 to cover their budget and current prices are an amazing opportunity to profit off of oil since unlike any other commodity, oil is practically running some countries like Saudi Arabia and my homeland Iran. so the price of it cant fall more than a certain amount (historically have never been under 17 and in this day and age, I cant possibly see it going down more than 21 and reaching that level is very unlikely as it is too) so...
Ignored
its going to hold above 55 and the next bull run will reach 70-75 and then we might see a correction and a fall back to around 50.
There are 3 indicators on the charts that I have been posting:
1. Keltner Channel 6-band Gradient Indicator:
The Keltner Channel Gradient indicator is one I put together, using 6 bands instead of 2. EMA20 is the centerline. Per the Keltner formula, the bands are centered around the centerline with spacing based on the average true range (ATR). I selected ATR multipliers that create a smooth gradient outward from the center. The Keltner bands are substantially smoother than the Bollinger bands, which are based on the standard deviation.
The bands give an indication of oversold/overbought conditions. Generally, the farther price is from the centerline, the stronger is the impulse to return toward the center. Often, a return toward the center has a price overshoot that extends into the opposing bands. Other times, prices will follow along the centerline for several bars, creating an opportunity to trade the breakaway move.
Trading with the bands is very similar to trading within a trading range.
I use the median line with it to show price action, particullarly trend movements. I also use bars instead of candles for better visibility.
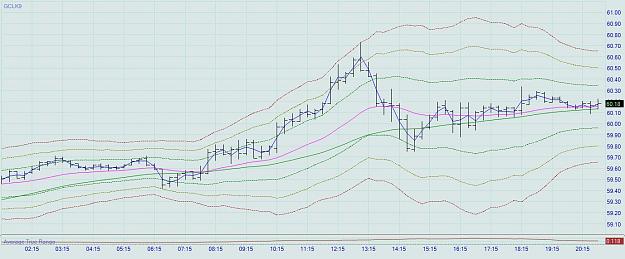
The figure below shows a chart with the KC gradient indicator alone, including EMA20 (magenta) & LWMA50 (green). The spacing between bands changes with changes in the ATR.
Interested MQ traders are welcome to use my KeltnerChanGrad indicator, version 2, linked below. It has some improvements over the earlier version.
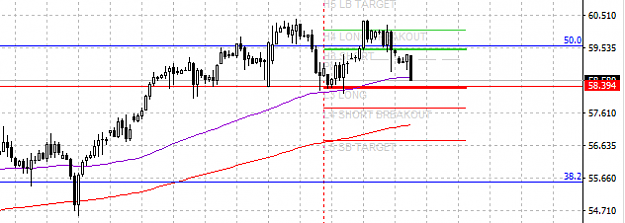
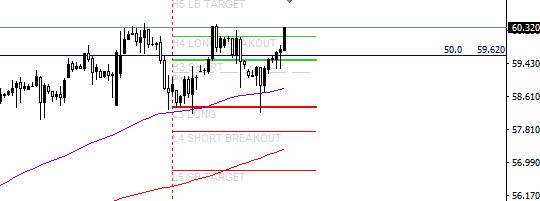
2. Parallel Trend Lines:
The parallel trend lines system I got from Ata (EURUSD Only), who got it from his predecessors. All reds are parallel; all blues are parallel. Reds have equal, but opposite, slope from blues.
If the median line crosses a blue or red line, expect some continuation with a good probability -- maybe for scalping or daytrading, sometimes for a swing trade. Look at median line crossing on Feb 10 of the red line at ~52.80. This was also a cross of the EMA20, followed by ~300 pips advance.
In March there were 14 crosses of trend lines. From the point of crossing to a closely following high or low, there was an average of 106 pips in price change.
If the median line bounces instead of crossing a blue or red line, consider playing it in the other direction.
The blue and red trend lines often form a pennant that can be watched for a trading signal.
3. Range Boundaries:
WTI often becomes range bound. I set the boundaries on my charts using median price values, which can show trading opportunities as price movements reflect off of the boundaries.
WTI: Supply worries join demand optimism, 200-day SMA in spotlight
1 April 2019, 08:59
The US sanctions and OPEC+ production cuts join reduction of the Baker Hughes rig counts and the US output decline to highlight supply worries.
Upbeat reports concerning the much-awaited trade deal between the US and China, coupled with welcome PMIs from China, pleased energy traders via demand optimism.
WTI trades near the day’s high surrounding $60.50 during early Monday. The energy benchmark recently rose as doubts over oil supplies from Venezuela and OPEC+ output reductions confronted optimism concerning the US-China trade deal and positive data from China.
While power outage and increased sanctions from the US have already weighed on Venezuela’s oil production, the Trump administration’s additional pressure on foreign firms to trade less oil with the nation tightened the global crude supplies. Adding to macro output constraint is OPEC+ production cuts that have been agreed by the Organization of the Petroleum Exporting Countries and Russia.
Further, 10 rigs’ decline in the weekly Baker Hughes US oil rig counts to 1006 and Reuters report signaling a drop in the US oil output in January to 11.9 million barrels per day became additional catalysts that together could portray supply worries.
On the demand side, positive signals for the US-China trade deal that has threatened global growth and future energy demand most of the last-year pleased oil buyers. Adding to that were welcome purchasing managers’ indices (PMI) from China that were published during Sunday and early Monday.
Next up in the focus will be developments surrounding how the world’s top two economies progress over the much-awaited trade deal ahead of Chinese delegated reach Washington on Wednesday. Meanwhile, upbeat prints of the scheduled manufacturing PMI from the UK and the US could also entertain WTI bulls.
WTI Technical Analysis
The oil benchmark needs to clear March 29 high near $60.80 in order to further rise towards $61.20 whereas 200-day simple moving average (SMA) level of $61.60 could challenge optimists then after. In a case prices rally beyond $61.60, it’s wise to aim for $62.30, an upward sloping trend-line since January 11 while being positive on the outlook.
In case prices fail to hold recent strength, $60.20, $60.00 round-figure and $59.60 seem nearby supports, a break of which can recall $59.00 and $58.10 on the chart.
persistence and determination alone are omnipotent
Starting to build a short position again. Looking for a retest of at least back to 60.00 even, will reevaluate from there. Potential for 62.50, but maybe it won't make it all in this run. If it does make it, I will look to start aggressively adding to position there.
Best to all, thanks Ll1979 and timingchain for your thoughts!