in pseudo code it looks like:
BUYING and SELLING on bollingerband:
Sell on upper band if:
[Daily %B(20,2.0,Daily Close) > 0.8] AND [Daily MFI(14) > 80] AND [Yesterday's Daily MFI(14) < 80] //here 2 oscillator indicators confirm overbought (the 2 indicators are MFI and %b indicators)
- strategy: 1. [bounce] 2. [breakout] // if 1 is chosen, then EA only buys on lower band and sells on upper band. If 2 is chosed, then the opposite happens, so the EA buys on upper band and sells on lower band.
- only allow trades if ADR is [lower or higher] than ATR //argument: if ADR is higher than ATR, strategy 1 [bounce] has a higher probability
- only allow trades if [x2, x3, x4] TFs also hit the same upperband or lowerband. //for example current TF (timeframe) is 15 minute, then x2 means 30M chart, x4 is H1 chart. So only allow trades if current price hits upperband (or lowerband) && (if selected x4) price hits upperband also in H1 timeframe.
- only allow buy orders in an uptrend on (DEFAULT)/off
- *TREND BASED ON SMA on (DEFAULT)/OFF: [Daily SMA(20,Daily Volume) > 40000] AND [Daily SMA(60,Daily Close) > 5] //this confirms we are in a trend
- SL 20
- TP 20
SECTION_B
Bands Period - Sets the period of the moving average our Bollinger band is based on. Recommended at 100 SMA this is x5 larger than normal setting.
Bands Shift - Sets the bar from which we calculate our Bollinger Band. EG 0 = current bar, 1 = previous bar
Bands Deviation - Sets the deviation calculation for price deviating from average.
Bollinger Price - Sets the price to which our calculation is based.
SECTION_C, here you can play with parameters that you like to add as well
Read this article on Bollinger Band secrets. Watch the YT videos in the article. Make sure to share your experience, opinions and trading tips from this article.
Below article shows that since 2010 there are new Bollinger Band indicators using BBimpuls and BB delta. Can anyone share these indicators?
Quote
Disliked
Indicators derived from Bollinger Bands
Quote
Disliked
In Spring, 2010, John Bollinger introduced three new indicators based on Bollinger Bands. They are BBImpulse, which measures price change as a function of the bands; percent bandwidth (%b), which normalizes the width of the bands over time; and bandwidth delta, which quantifies the changing width of the bands.%b (pronounced "percent b") is derived from the formula for Stochastics and shows where price is in relation to the bands. %b equals 1 at the upper band and 0 at the lower band. Writing upperBB for the upper Bollinger Band, lowerBB for the lower Bollinger Band, and last for the last (price) value:%b = (last ? lowerBB) / (upperBB ? lowerBB)Bandwidth tells how wide the Bollinger Bands are on a normalized basis. Writing the same symbols as before, and middleBB for the moving average, or middle Bollinger Band:Bandwidth = (upperBB ? lowerBB) / middleBBUsing the default parameters of a 20-period look back and plus/minus two standard deviations, bandwidth is equal to four times the 20-period coefficient of variation.Uses for %b include system building and pattern recognition. Uses for bandwidth include identification of opportunities arising from relative extremes in volatility and trend identification.
Above article:
- discusses more about %b, delta, impulse, BBindex, BBmomentum, BBtrend, BB persist, etc
- explains in detail how to trade Bollinger Band in trend and ranged market. (filters, Aroon, etc)
If you want to share, let us know your opinion and trading tips from this article.
{quote} Hi Michael, I'm using MT4 so will have to look i to how to add a H1 BB onto a 5min chart. Im guessing theres an EA/Indicator out there somewhere for this. I think i understand what you mean in that by checking that the price is also within the H1 BB on a 5min chart, this would add strength to the direction price may then go.... NB i'm using the H4 RSI crossover of 50 as my initial trigger to even look at a trade, then applying the BBs to it. I'll have to do some research into Donchian Bands they are totally new to me. As for a trending market...
Ignored
You stated: "Hi Michael, I'm using MT4 so will have to look i to how to add a H1 BB onto a 5min chart. Im guessing theres an EA/Indicator out there somewhere for this."
Reply:
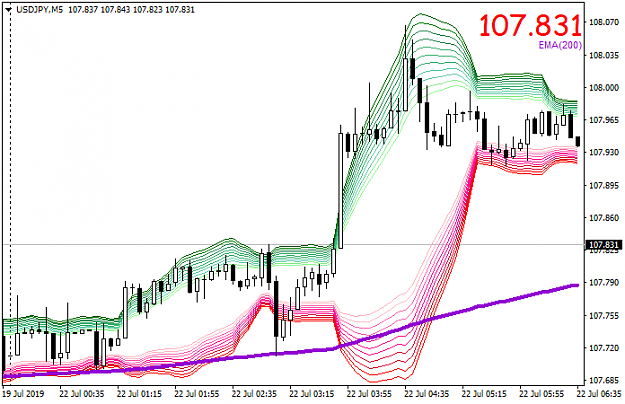
It's not a MT4 function. For this, you have to download a custom indicator, with the name MTF Bollinger Band. There are maybe 20 different versions of MTF BB out there. An MTF BB mixed with ichimoku in one indicator is here: https://forex-station.com/viewtopic....er#p1295376465
How to use:
1. Go to M5 chart
2. Add 2 of the same indicator. In one indicator change the settings from timeframe M5 to H1.
MTF:
MTF just means multi timeframe. Modern indicators have MTF in their name, especially neat in combining with multiple indicators from different time frames on the same chart.
In this thread we will build our own Bollinger Band strategy by combining our heads together. Let's discuss:
DISCUSS:
- what do you think is the best way to recognize RANGED and BREAKOUT?
- what other indicators complement the Bollinger Band?
- what is in your experience the best timeframe for Bollinger Band?
- what do you confirm before entry?
- what conditions do you think should be met in the higher timeframe (before entry)?
- what Price Action do you think is best with Bollinger Band? (HnS, M, doji, other)
- what conditions (if/else) for our Bollinger Band strategy do you think could be helpful?
- what are the differences between volatile penetrations of the outer bands, common trend and correction penetrations?
- Please add as many links as possible
CONDITIONS:
- RANGED: buy on lowerband, sell on upperband
- BREAKOUT: buy on upperband, sell on lowerband
In this thread we will build our own Bollinger Band strategy by combining our heads together. Let's discuss: DISCUSS: - what do you think is the best way to recognize RANGED and BREAKOUT? - what other indicators complement the Bollinger Band? - what is in your experience the best timeframe for Bollinger Band? - what do you confirm before entry? - what conditions do you think should be met in the higher timeframe (before entry)? - what Price Action do you think is best with Bollinger Band? (HnS, M, doji, other) - what conditions (if/else) for our...
Ignored
I am in fact working on an indicator to determine whether the market is ranging or if it is a breakout. My current approach is doing this by comparing the change of the 20-MA (same as Bollinger Band) and the change of Bollinger Bandwidth. My thinking is, that when the change of Bandwidth is higher than the change of the Moving Average, it is most likely a Breakout. But since my coding skill is still pretty basic, it takes me a while to finish my indicator and test this ...
First you need to know how many candle sticks (cs) backwards re-paints your indicator.
If its 1 or 2 cs two you could pretect your signal with the feature open/ closed/ 2 closed or 3 closed candles stick - its a kind of treshold.
I use in my own EA also re-painting signal entry indicators like TSR, Signal Line or MTI. It is working.
Regarding normal Bollinger Bands, I propose to have a look at alternative Bands like:
ATR Channel MTF
Better Bollinger Bands
BMA Bands
Keltner Channels X2
Jurik Bands
MASR Bands
Most of them you could find for free here in www.
Do you consider the 4:1 law of Bollinger Bands. Use a 1h chart and place within a 4h Bollinger Band and compare it with 1h Bollinger Bands - you will see the significant differences.
Siedways:
- I recommened the BB Trend Flat (look at MQL5 websides)