- Search Energy EXCH
- 192 Results (4 Threads , 188 Replies )
-
 Abe16 replied Feb 5, 2020
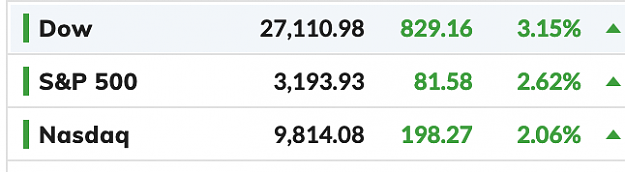
"The end of the US stock market" seems rather elusive. image
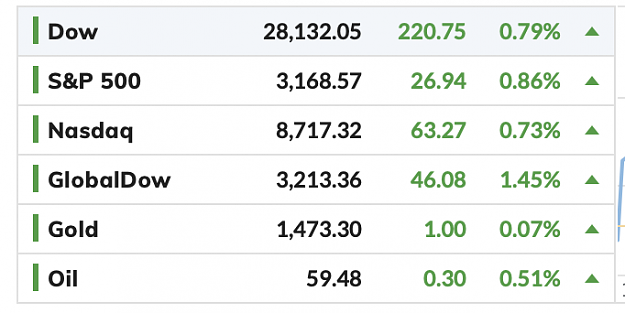
The end of the US stock market is nearing
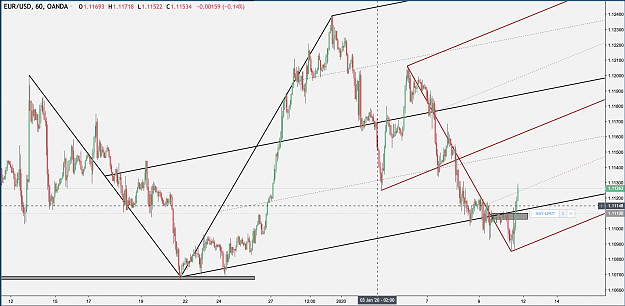
- Abe16 replied Jan 16, 2020
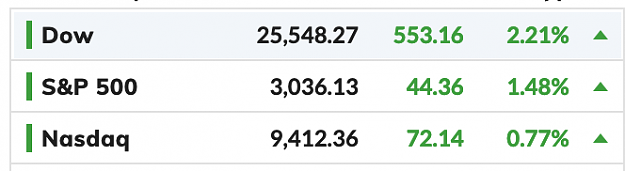
Thanks for the sell stops!!! image
The end of the US stock market is nearing
- Abe16 replied Dec 16, 2019
Interesting. So Olga Hoffman is your wife. image
The end of the US stock market is nearing

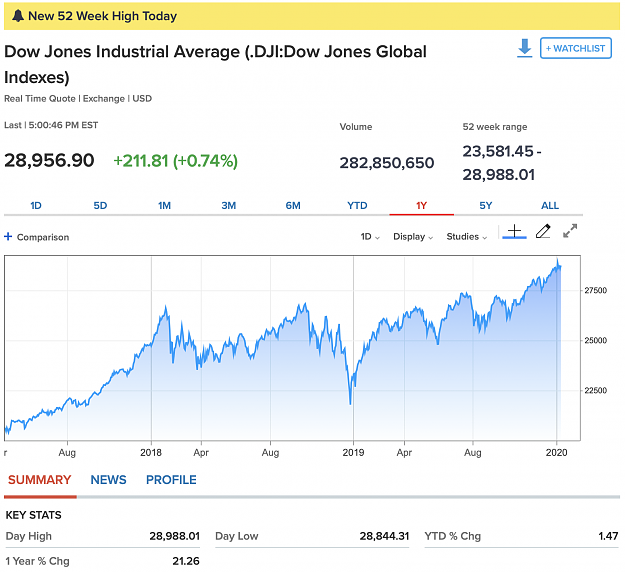
- Abe16 replied Dec 16, 2019
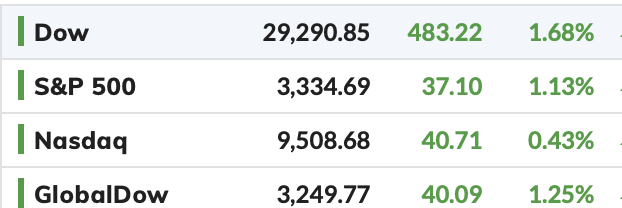
DOH!!! Another all-time high!!! Like I said. A broken watch is right at least twice per day. LOL!!! What a hysterical thread this is. image
The end of the US stock market is nearing
- Abe16 replied Dec 14, 2019
Beware. This individual has something to sell. image image image
Trading book(s) - please recommend if you can


- Abe16 replied Dec 14, 2019
States he's a fund manager since 1993 image image
The end of the US stock market is nearing


- Abe16 replied Dec 14, 2019
This whole thread is an advertisement. Now the reason for the sensationalism is clear. image
The end of the US stock market is nearing

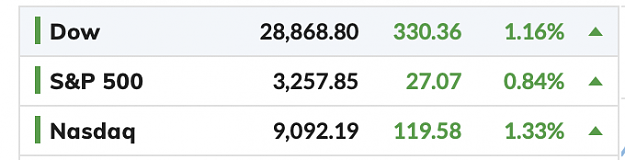
- Abe16 replied Dec 12, 2019
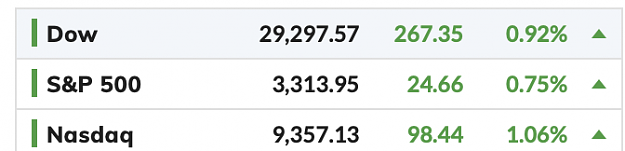
Oh Man!. Just can't stop winning. I love all you US sellers! image
The end of the US stock market is nearing
- Abe16 replied Nov 12, 2019
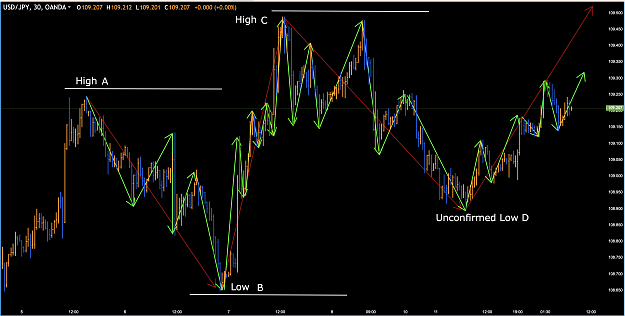
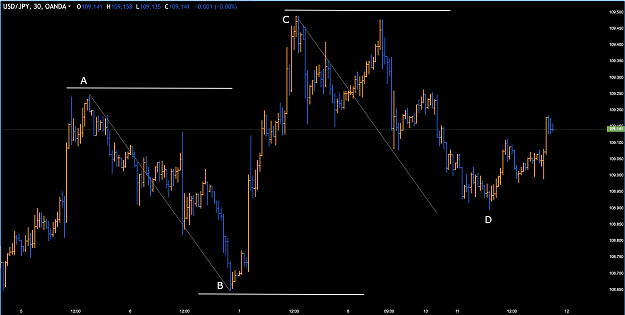
Hey Munchie, I'm having a difficult time understanding your blue rectangle markings. They don't seem to consistently identify sequential highs and low. The chart below is USDJPY 30 min. It is busy but I want to be clear about swings. The red arrows ...
Fundamentals of Trading for Rookies
- Abe16 replied Nov 11, 2019
USDJPY30min looks good to me. Instead of vertical lines to measure I'm going to start using diagonal lines to measure. So in this case the A-B swing is duplicated and pasted on the C-D swing. The pasted line is just a measurement so don't expect it ...
Fundamentals of Trading for Rookies
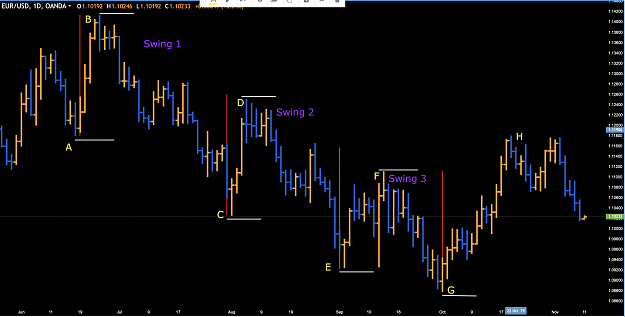
- Abe16 replied Nov 11, 2019
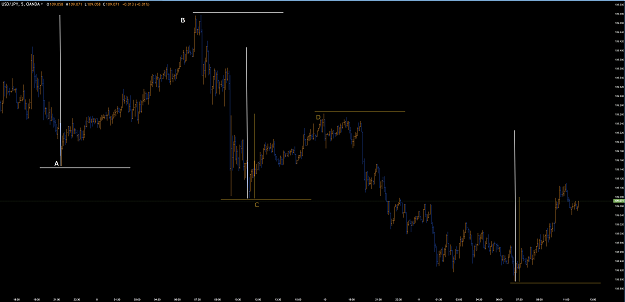
In keeping with what we've learned in this thread so far I've marked out the largest swings. I've also measured them as shown. Price has been trending down overall. A-B is the largest reactive leg. The white vertical line measures it. B-C is the ...
Fundamentals of Trading for Rookies
- Abe16 replied Nov 11, 2019
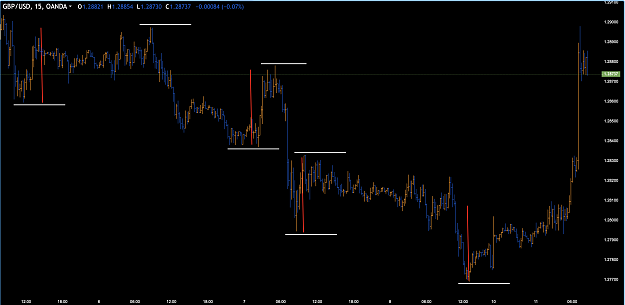
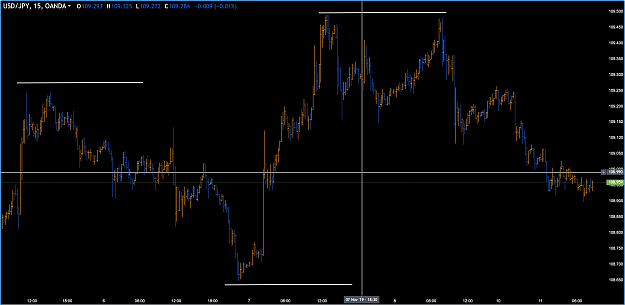
Here's a couple of 15 minute charts we can follow together. Swings are shown. We'll see what happens. Comments are welcome. image image
Fundamentals of Trading for Rookies
- Abe16 replied Nov 10, 2019
Measured Swings In review we've basically discussed the most important fundamental of understanding price action: SWINGS We've gone over how one can identify swings using the definitions: A new high confirms a swing low - uptrend beginning. Series ...
Fundamentals of Trading for Rookies
- Abe16 replied Nov 10, 2019
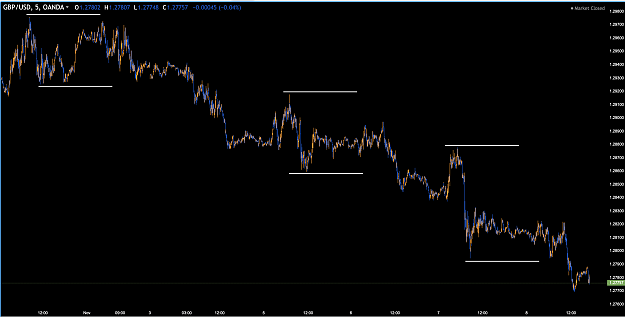
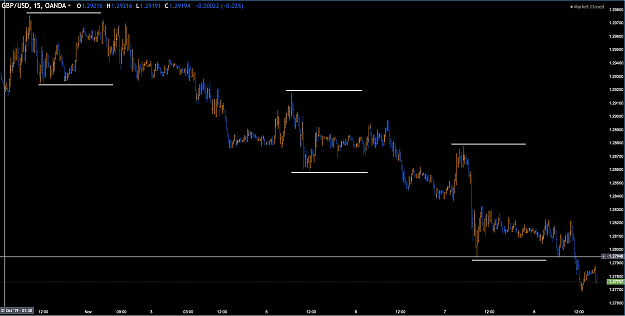
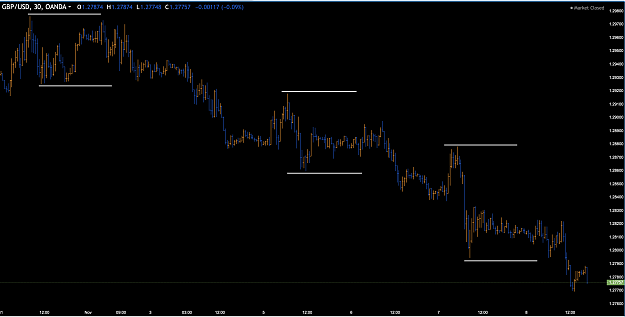
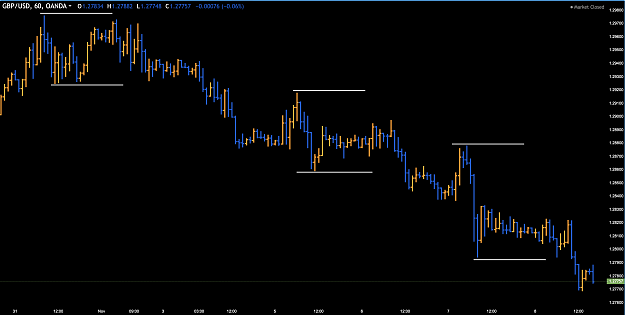
This is GBPUSD showing charts on 5, 15, 30 and 60 minute time frames. Each one can stand on its own. Each one can be traded by itself without looking at any of the others. image image image image
Fundamentals of Trading for Rookies