- Search Energy EXCH
- 166 Results
-
 birdt replied Mar 11, 2010
Perhaps the question you ought to be asking yourself is why your expectations were so high that your bullish stance on JPY would be vindicated based on a 'bearish' candle? I could give you a handful of technical reasons why Tuesday morning wasn't a ...
Trying to understand a whipsaw
- birdt replied Sep 3, 2009
I guess that depends if you only have one strategy and that particular strategy's success is reliant upon volatility/trendiness. I have learned to love the Asian range. Frequently enough I am left a pleasant gift by the market when I awake. It ...
Trading for a Living - Cliff Notes
- birdt replied Sep 3, 2009
I recall (although not the source) that 32% of forex volume goes through London trading desks, more than any other location. The UK has traditionally been the centre of the foreign exchange industry and I suspect this is still the case now. However, ...
Trading for a Living - Cliff Notes
- birdt replied Sep 2, 2009
The 'bucket' play as I understand it is quite similar to Sam Seiden's method of identifying areas where price has previously displayed imbalances in supply and demand and speculating that there will be clusters of limit orders which will see price ...
In love with patterns
- birdt replied Jun 23, 2009
I had this pitchfork drawn on following the bearish looking price action and formation of lower lows at the beginning of the month which suggested the possibility that EU was topping out. After the break of the neckline of the subsequent head and ...
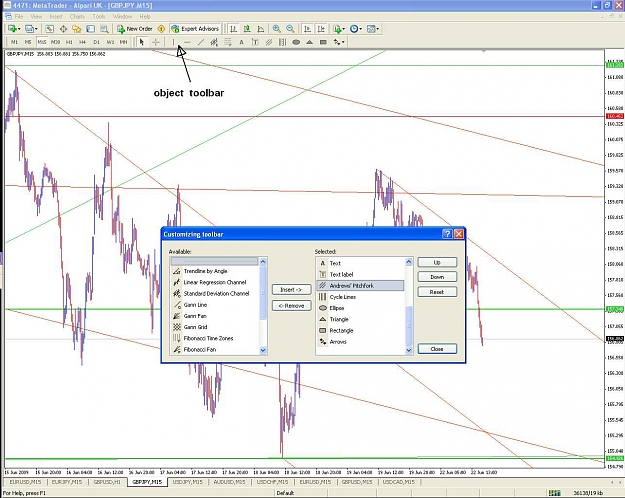
Andrews Pitchfork (Median Line)
- birdt replied Jun 22, 2009
The MT4 Andrews Pitchfork tool in metatrader that Fx California was referring to. You were saying that you had to construct the pitchfork structure yourself. Whilst that may be the case on your platform, most technical analysis charting packages ...
Does anyone here trade daily?
- birdt replied Jun 1, 2009
OK Wasp, 5 major lines which tell a story about the trend and potential S/R. All in the past now though of course and there is no obligation for price to respect them in the future. Red TL, broken. End of impulsive down trend. Retested on higher ...
Naked S/R intent trading
- birdt replied Jun 1, 2009
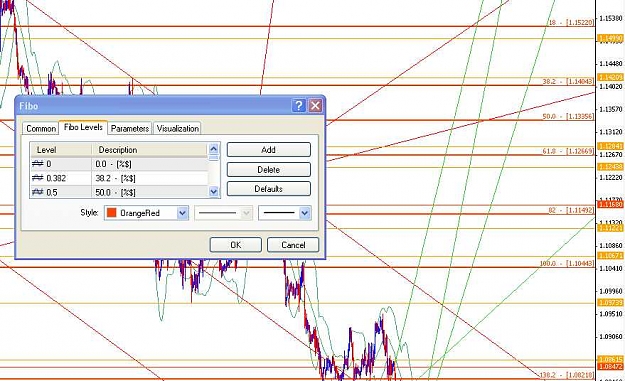
The %$ is the main bit you need. The bracket and dash just makes it look a bit neater.
Numbered Fibonacci Lines on MT4
- birdt replied May 29, 2009
Been a while since I looked in here. Not sure if anyone has spotted it, but it's a fairly obvious level on UJ with confluence at the 50 fib of last swing. Last time price was at this level, buyers dominated sellers and so could represent value to ...
No Brainer Trades
- birdt replied Apr 30, 2009
Nice set-up there M. As for price projections following a trendline break, of which a channel is two parallel trendlines that has described the path of price, you might want to check out some of Tom Demark's methods, or Alan Andrew's Action/Reaction ...
5M Channel Scalping - 100pips \ week
- birdt replied Apr 27, 2009
Right click on the Order ID in Terminal and go to Modify or Delete Order. Then select Market Execution. Here you can alter the Volume which you want to close.
Fragmented positions
- birdt replied Mar 25, 2009
OK, so now we have a trend line drawn which described past price effectively, and we have a zoom bar which has blown through, apparently violating it. Now, some might dismiss the trend line and draw a new one. Some might keep it on in case of a ...
Trading setups around SR Zones
- birdt replied Mar 25, 2009
"Yeah alright birdt, cut to the chase and stop harping on about Zoom bars, this is a support and resistance thread." Steady on fella, I'm getting to the interesting part now. The zoom bars will often be found at break-outs, like I mentioned earlier, ...
Trading setups around SR Zones
- birdt replied Mar 25, 2009
I have always advocated using stop entry orders to get into trades from S/R - letting the price action tell me what it is doing before making my decision on whether to fade, breakout or stand aside. Certainly this would appear to be safer for ...
Trading setups around SR Zones
- birdt replied Feb 25, 2009
Technically it looks long on this time frame. Yesterday was all bearish but didn't break this support level so my bias has not changed. See what happens at London open, no point in getting married to any trade ideas. Opportunities abound to the ...
GY Direction?
- birdt replied Feb 20, 2009
Live. It was a buy stop order at 1.4226, got filled at 1.4273. I don't know how many times it ticked between these two prices but it was a rapid move on news at 0930GMT. I use stop orders to get in the market quicker than market orders, do they ...
MB Trading Futures - Introduction
- birdt replied Feb 13, 2009
4:1 stop loss? Sounds a bit much to me. A bit like throwing darts, but hey, if it works for you and it's there for the right reasons then far be it from anyone else (me included) to pass comment. IMO your stop loss should be placed at the exact ...
How you place your stop loss?

- birdt replied Feb 10, 2009
What qualifies as the 'best' time is that time which most frequently fulfills the conditions that your strategy is designed to capitalise upon. Squabbling over the 'best way' of trading, and the 'best time' to trade etc. betrays a closed mindedness ...
The best Times of day to trade - or Not trade
- birdt replied Feb 3, 2009
I think 1-2-3's are about as good an indication of a shift in market sentiment as you're going to get, and that is what I look for when I am looking to fade a S/R level, although I think the 5m is a bit 'noisy', unless you're looking for any excuse ...
The best support and resistance levels
- birdt replied Feb 3, 2009
There are three areas I'd be looking at price action. First thing to notice is that price is in a range and I'd be favouring a breakout. I'd expect a break above the double top to be vigorous enough and may set the tone for the rest of the London ...
The best support and resistance levels