- Search Energy EXCH
- 31 Results (2 Threads , 29 Replies )
- akift replied Nov 11, 2020
Hi Mattia, I haven't forgot your requests but they are not there yet. But for daily and weekly you can use the rectangular one. Here is a screenshot. image Akif,
Market Statistics (Volume Histogram, VWAP with SD bands)
- akift replied Sep 19, 2017
I have uploaded an updated version of classic dragging line market statistics indicator. Have fun. Akif, image file
Market Statistics (Volume Histogram, VWAP with SD bands)
- akift replied Sep 13, 2017
Hi everybody. Since there is still some interest in Market Statistics, I will add another updated indicator here for your trial. This one is a little bit different to use. After adding the indicator to your chart, just draw a rectangle representing ...
Market Statistics (Volume Histogram, VWAP with SD bands)
- akift replied Jan 30, 2017
I dont get sorry for these fails. The level was good, it just didnt work out. Now 1.0692 looks good for a short. image Akif,
Trader Dale - daily trading levels
- akift replied Jan 29, 2017
After a full day of sitting in front of the monitor coding and debugging here is something different to look at. I managed to download historical real tick data from internet and feed this data to our beloved the volume profiler tool. Now I could ...
Trader Dale - daily trading levels

- akift replied Jan 26, 2017
Thanks Ziggy. My cleanest call so far
Trader Dale - daily trading levels image Akif,
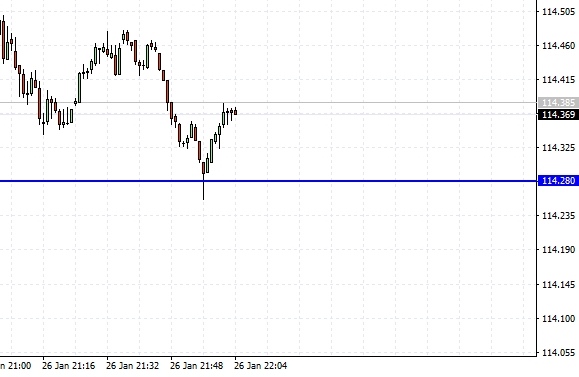
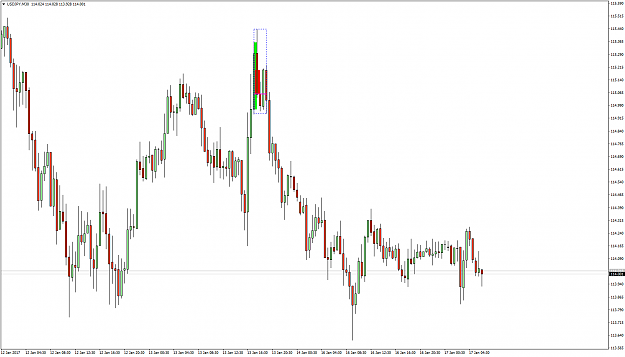
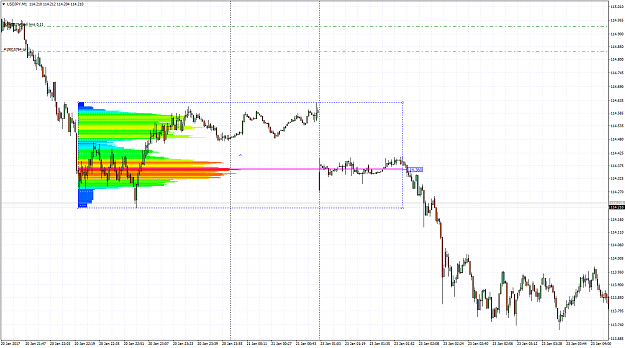
- akift replied Jan 26, 2017
Hey UJ, if you happen to fall I'll catch you at 114.28. image Akif,
Trader Dale - daily trading levels
- akift replied Jan 26, 2017
It was probably more of a S/R based level than volume. image Akif,
Trader Dale - daily trading levels
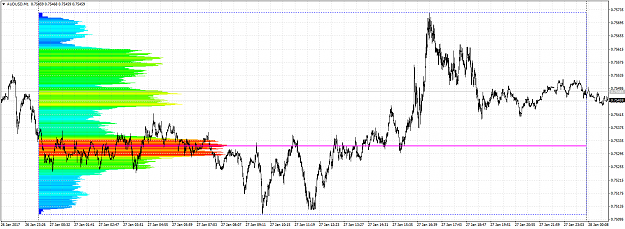
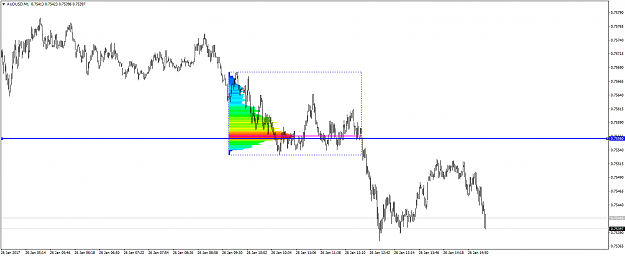
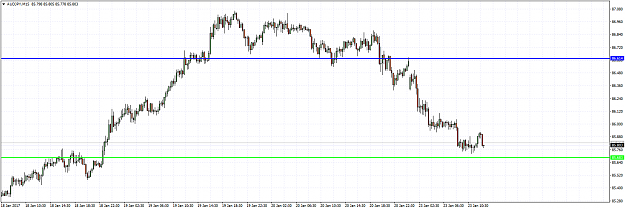
- akift replied Jan 26, 2017
I am looking for a possible short level on AUDUSD. image Akif,
Trader Dale - daily trading levels
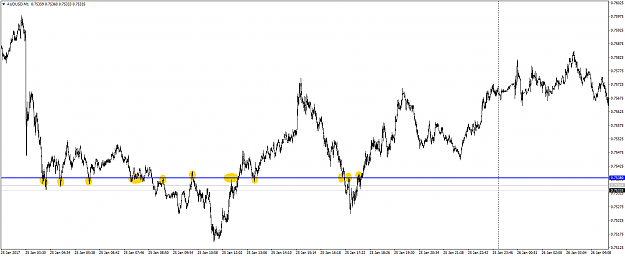
- akift replied Jan 26, 2017
It looks like volume cluster won against gap. image Akif,
Trader Dale - daily trading levels
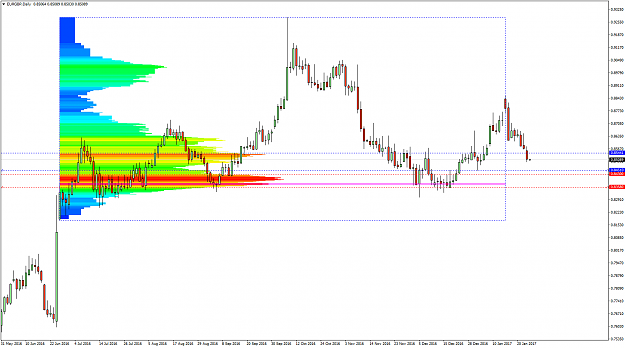
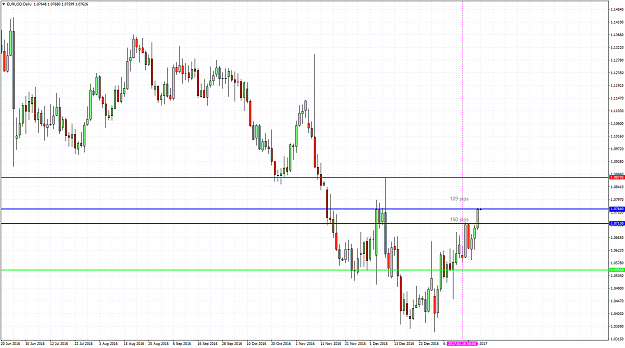
- akift replied Jan 25, 2017
Dale, Quick question about EURGBP swing long level. What is the reason behind choosing 0.8544 instead of 0.8430? To my newbie eye, it looks like a stronger candidate. Is this because not missing the opportunity? Thanks in advance. image Akif,
Trader Dale - daily trading levels
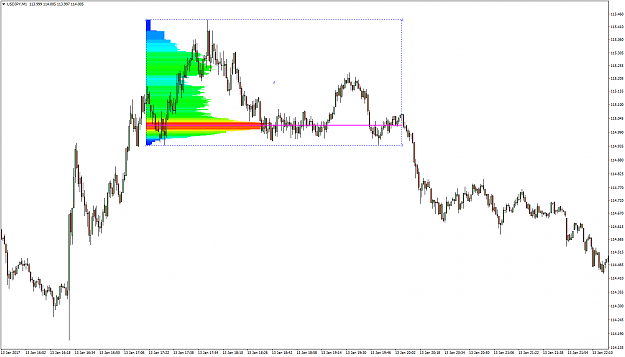
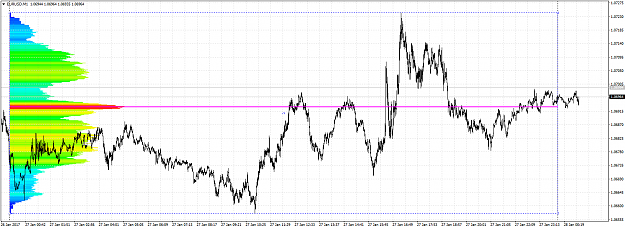
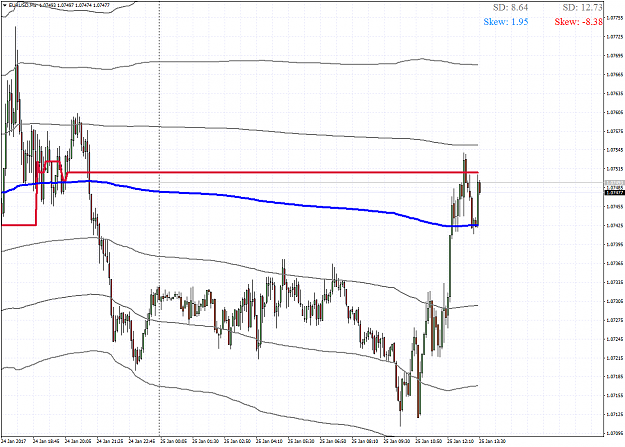
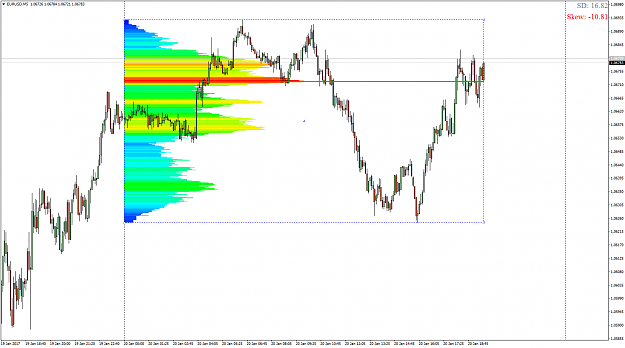
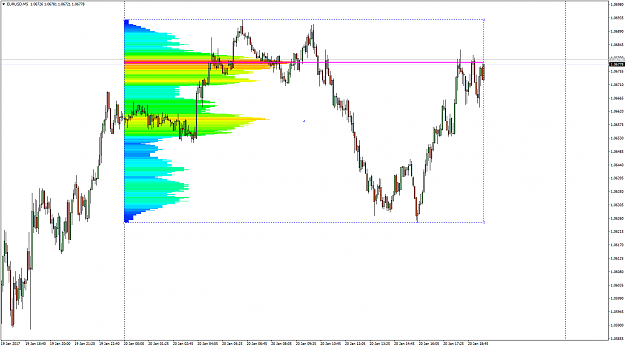
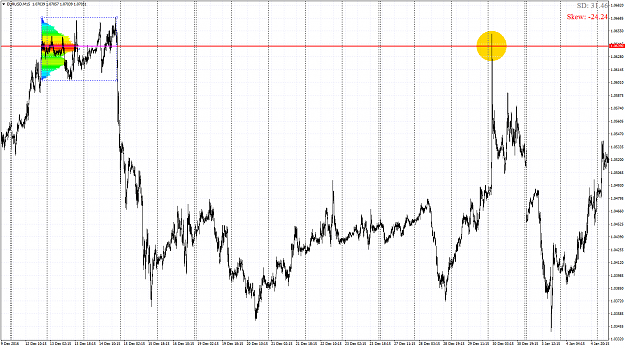
- akift replied Jan 25, 2017
Just to put Market Statistics perspective on EU. This is 2 days' Market Statistics profile. We traded up from PVP(Peak Volume Price) down to VWAP. Exactly matching with Dale's levels. Skew is down so we should be looking for shorts if we manage to ...
Trader Dale - daily trading levels
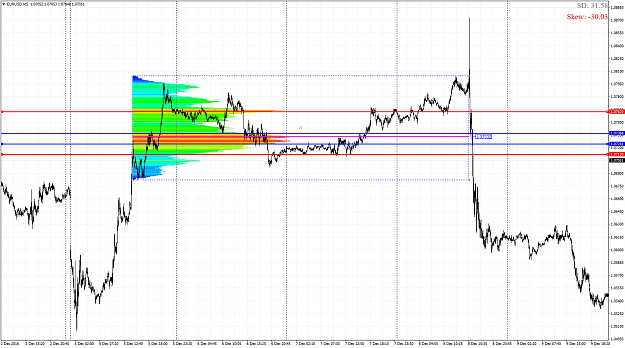
- akift replied Jan 23, 2017
Dale, We skipped the EU swing short part-1 because of ECB event. Now part-2 level (1.0764) is triggered. Is this still valid after 125 pip reaction from part-1 level (1.0713). Thanks. image Akif,
Trader Dale - daily trading levels
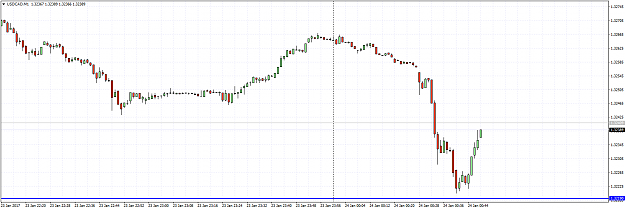
- akift replied Jan 23, 2017
UCAD turned 1 pip earlier. image Akif,
Trader Dale - daily trading levels
- akift replied Jan 23, 2017
AUDJPY swing short missed TP by 4 pips. Waiting... image Akif,
Trader Dale - daily trading levels
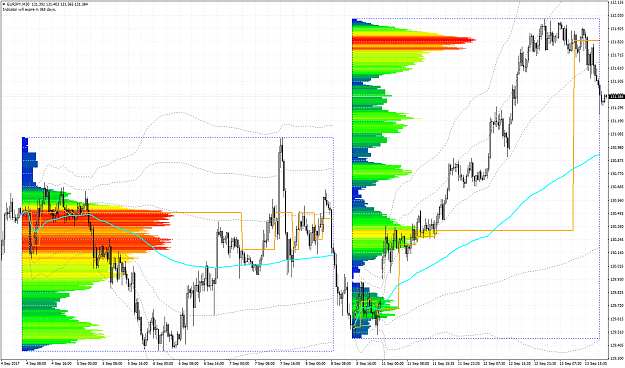
- akift replied Jan 20, 2017
Just making some modification to the profile indicator. This is how it looks if I use time instead of using tick volume. Anybody with future volume access, can you post a screenshot to see which one is a better representative. Thanks in advance. ...
Trader Dale - daily trading levels
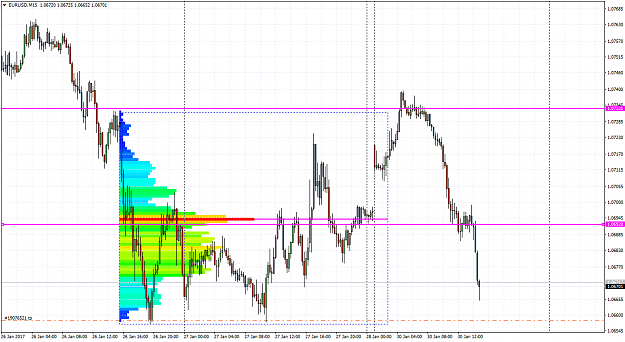
- akift replied Jan 20, 2017
EU returned from SD2, running to the VWAP. VWAP will be positioned probably around the previous POC of today's profile (around 1.0658) when price reaches it. It looks like there will be a nice short opportunity there. Lets wait and see. image Akif,
Trader Dale - daily trading levels
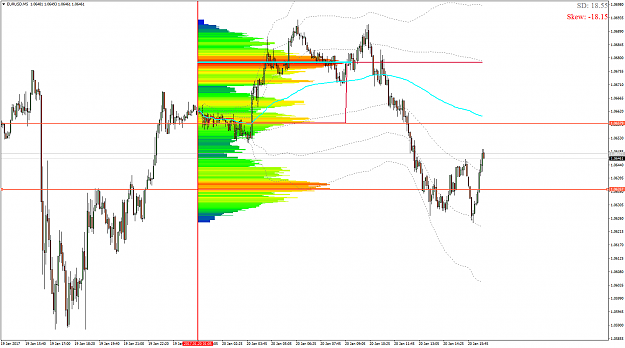
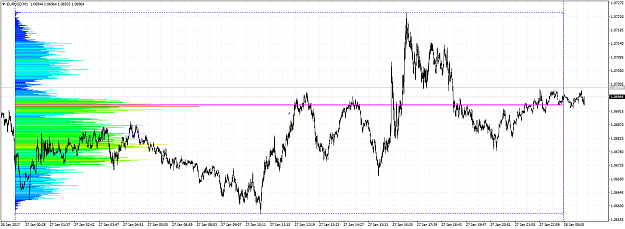
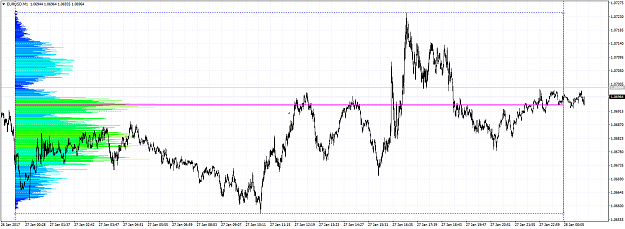
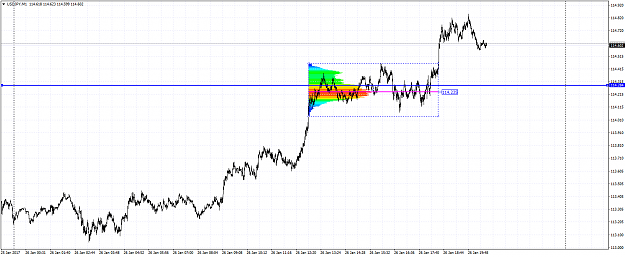
- akift replied Jan 20, 2017
Well thanks Dale for helping me bank that +10. And this my M1 Market Statistics view of EU: Precise reaction from first Std Dev of Daily VWAP. Clear short signal. Easy on hindsight
Trader Dale - daily trading levels image Akif,
- akift replied Jan 17, 2017
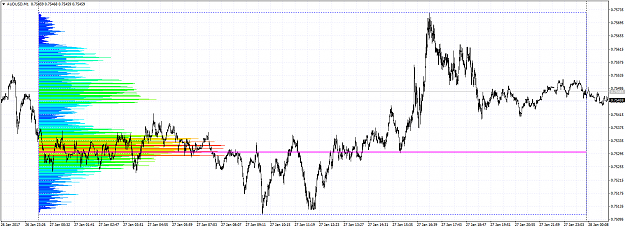
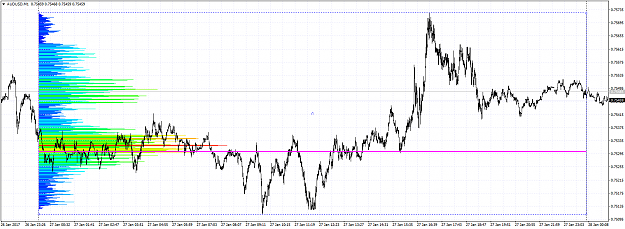
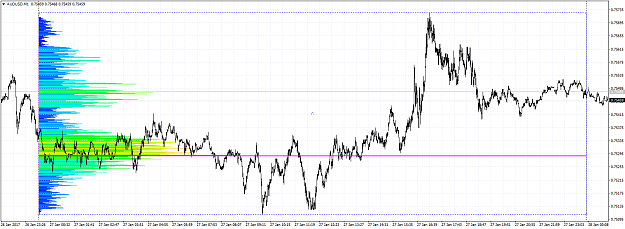
Anatomy of a Dale's Level
Trader Dale - daily trading levels Ok here is my surgical skills for the pinpointing the EURUSD Swing Short Level. The reason for the Part-2 level 1.0764 is pretty clear. But if I were to select the levels I would probably choose 1.0724 and instead of ...
- akift replied Jan 16, 2017
Hi Naughty, If those small color ones are the result of my indicator then there is something wrong with it. And now I can understand what ruma is trying to tell. It shouldnt go over the rectangle. Pls take a look. image And for precision u need to ...
Trader Dale - daily trading levels