- Search Energy EXCH
- 2,505 Results
-
 Nala66 replied 4 hr ago
The daily pivots such as the S1 S2 etc are supplied by your broker in the tool list. Mine is called Auto Pivots. I then remove the ones I am not interested in. I am at a loss to understand why you cannot see targets for today. Look at the15-min ...
Trading the Cable swings via averages
- Nala66 replied 16 hr ago
Here is the workings of the 5-min chart today... image If you cannot get the required pips from this then you are doing something wrong.
Trading the Cable swings via averages
- Nala66 replied 16 hr ago
1) Yes, the 108 bar is about the London open and is the time I start to look for trades. I am in Australia, so it is about teatime for me round about 5pm depending on daylight saving. 2) Anything to do with long term trading is very inefficient as ...
Trading the Cable swings via averages
- Nala66 replied Apr 20, 2024
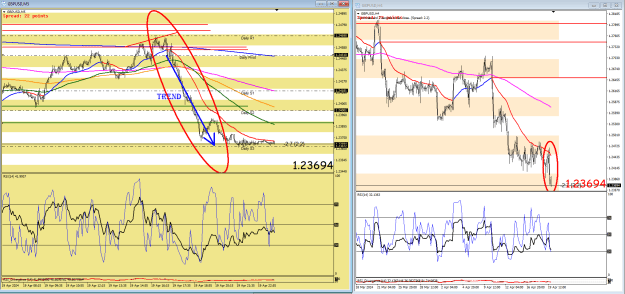
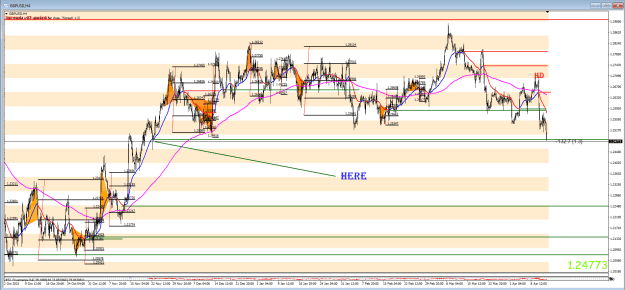
Yep, these are all good. Now because this is the 4-hour chart we treat these divs as ZOO points. Zones Of Opportunity and we drop to a lower time frame to trade them. Dropping to the 5 min chart we would identify an entry and would see a trend in ...
Trading the Cable swings via averages
- Nala66 replied Apr 18, 2024
Also, on the 4-hour chart you posted there were 5 different divs to take advantage of...
Trading the Cable swings via averages
- Nala66 replied Apr 18, 2024
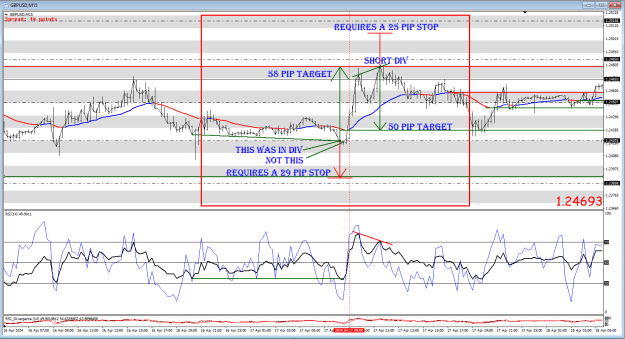
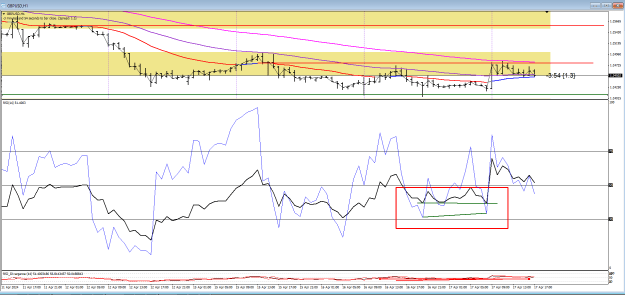
Sorry I did miss the question! Here is the 15-min chart. The part we are looking at is inside the red box. Also added is the risk reward ratio of 1:2. image As for the horizontal lines. I use a red one to mark the past swing high average and a ...
Trading the Cable swings via averages
- Nala66 replied Apr 17, 2024
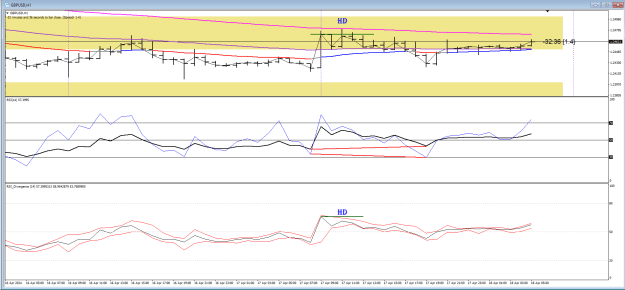
I see what is going on with your chart. You are using the two speed RSI to look for HD's. You should be using the historical RSI. It is because the divergence is hidden that we have to look at the total repainted moves of the RSI to see if it was ...
Trading the Cable swings via averages
- Nala66 replied Apr 17, 2024
There was a bull RSI div on the 1-hour but it was harder to spot....
Trading the Cable swings via averages
- Nala66 replied Apr 17, 2024
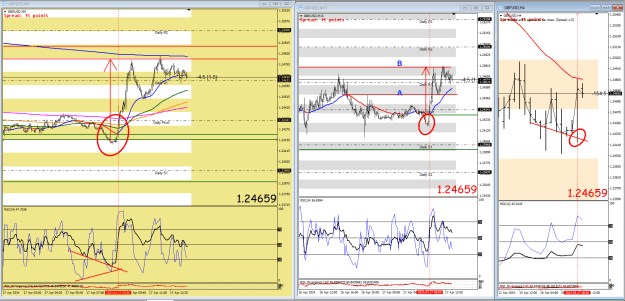
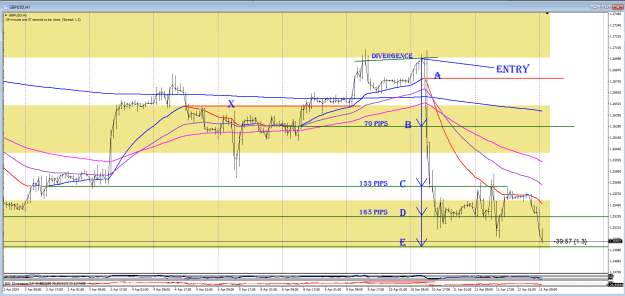
We see at the appropriate TIME. We have a bull div on the 4-hour chart. On the 5-min we see the SIGNAL to go long with about a 60 pip TARGET. On the middle chart (15-min) we see additional confirmation. If the average is to break A then price should ...
Trading the Cable swings via averages
- Nala66 replied Apr 15, 2024
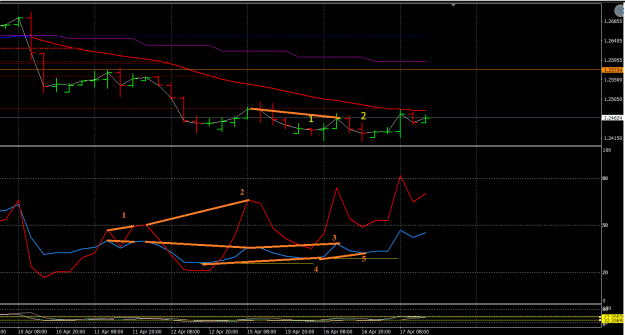
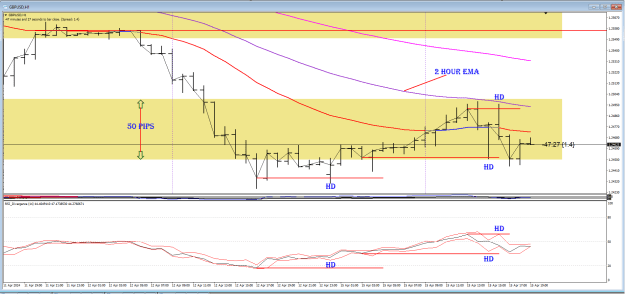
As I have said many times in the past hidden divergence is a great way to trade. Just look at the options here on the 1-hour chart... image We can also see that price is banging its head on the 2-hour EMA. Each HD has at least made it back to the ...
Trading the Cable swings via averages
- Nala66 replied Apr 15, 2024
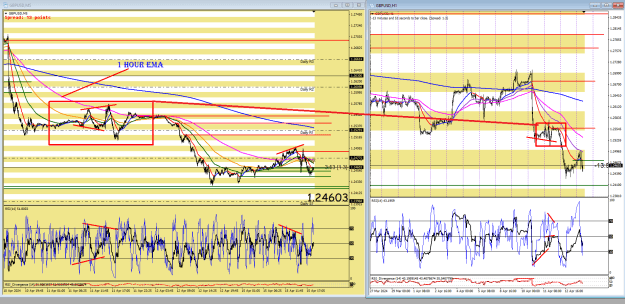
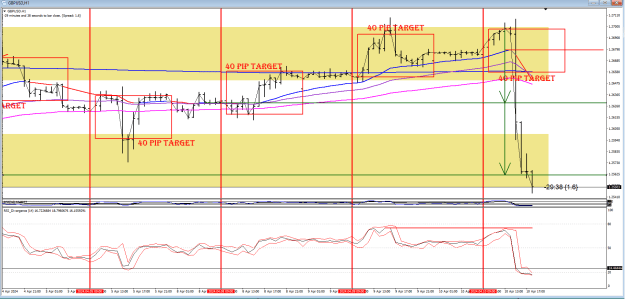
OK we have a bull div in this case, it should at least return price to the EMA which is in itself quite a few pips for the taking, some 40 pips or so. This is best viewed at the 5 min level where we see a bull div take price back to the 1-hour EMA. ...
Trading the Cable swings via averages
- Nala66 replied Apr 12, 2024
Did you all guess correctly on the 4-hour chart??????? image
Trading the Cable swings via averages
- Nala66 replied Apr 12, 2024
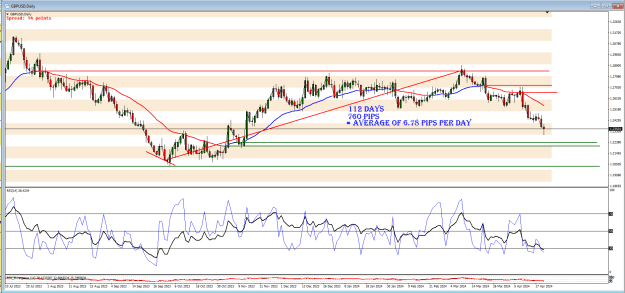
The higher the time frame the longer it takes for the charts to set up. Guess what this 4-hour chart is going for? image A bull divergence could easily stop it.
Trading the Cable swings via averages
- Nala66 replied Apr 12, 2024
I hope that last post was not too much of a headache. Take a look at this 15-minute chart and then reach for the tablets. image
Trading the Cable swings via averages
- Nala66 replied Apr 12, 2024
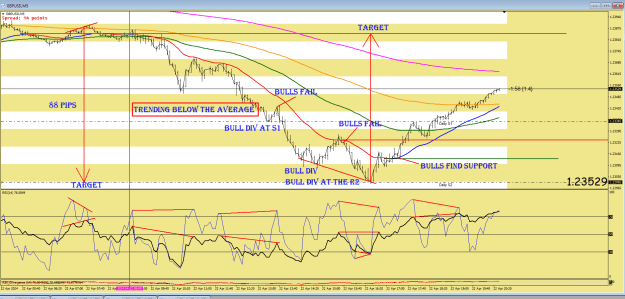
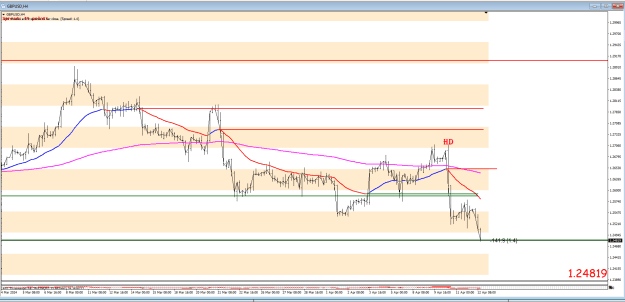
This is a big question but maybe a refresher is needed. Glad you picked the 1-hour chart because there is not too much to explain there. The first this is I use a red horizontal for the average tops and a green horizontal for the average bottoms. I ...
Trading the Cable swings via averages
- Nala66 replied Apr 10, 2024
I had it a tad different... It was also in div on the 5 and15 minute charts.
Trading the Cable swings via averages
- Nala66 replied Apr 9, 2024
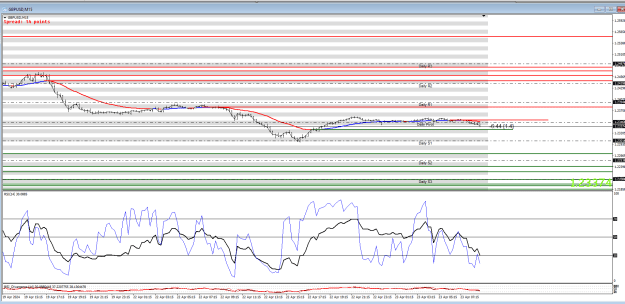
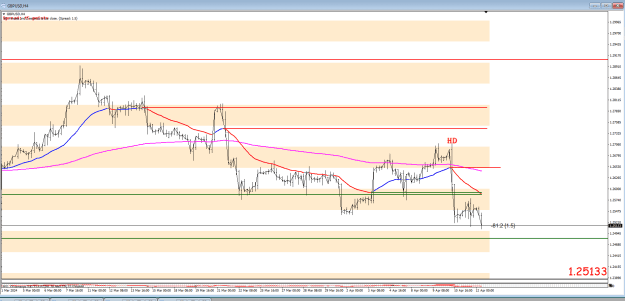
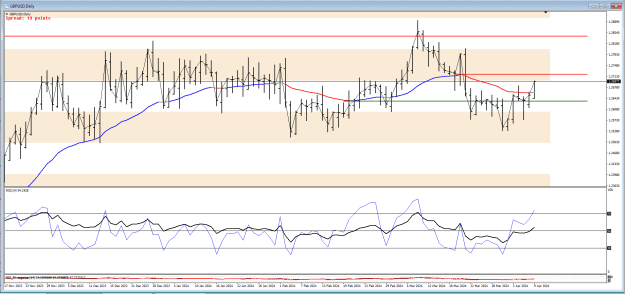
Now, when I look at the daily chart, I can see the failure of the average to make the LL so price is now testing the opposite side. image
Trading the Cable swings via averages
- Nala66 replied Apr 9, 2024
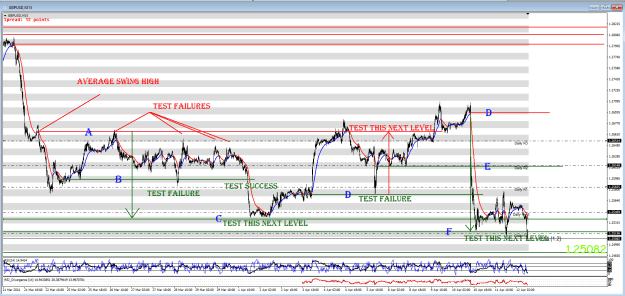
And thus, the task is completed for this day... image
Trading the Cable swings via averages
- Nala66 replied Apr 9, 2024
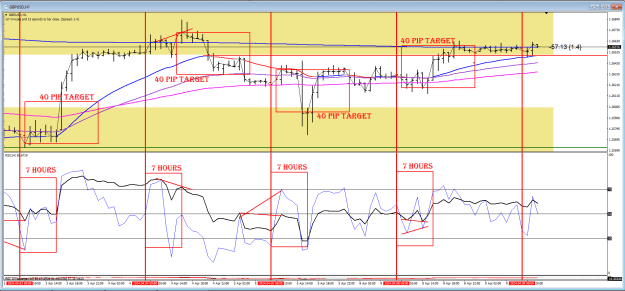
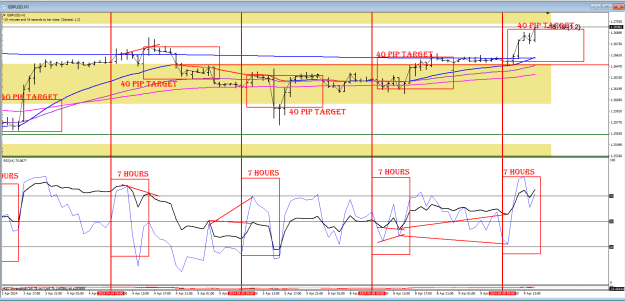
The trick is to keep it simple. Look at the 1-hour chart below. I have the red vertical timeline on the price chart... This is approximately where I start my day looking for opportunities. On the RSI I have a red box spanning some 7 hours. If I ...
Trading the Cable swings via averages