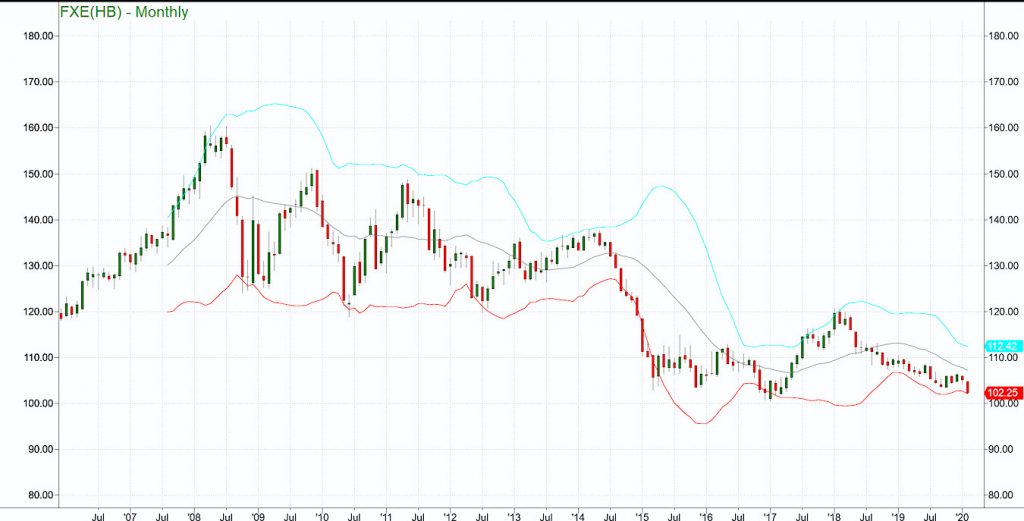
In 1980 John Bollinger came up with the formula called Bollinger Bands.
Bollinger used a moving average with two trading bands above and below it.
Unlike a percentage calculation from a normal moving average, BB’s simply add and subtract a standard deviation calculation (a formula that measures volatility).
When stock prices continually touch the upper BB the prices are thought to be overbought; conversely, when they continually touch the lower band, prices are thought to be oversold, triggering a buy signal.
I like to use Bollinger Bands on monthly charts.
For a longer timeframe, it’s an incredibly reliable layer along with RSI (relative strength indicator) and historical support and resistance.
I have an invested reason for watching the US dollar and the Euro currency.
Note-the US Dollar is the mirror image of the Euro only in reverse.
As many commodities have rallied despite the very strong dollar, if the BB, oversold conditions and historical support suggest the Euro could rise in price, what does that mean for our commodity positions?
The dollar has strengthened for several reasons.
“The most plausible explanation for ongoing dollar strength is that investors globally want to own U.S. assets because they have the highest confidence in the U.S. economy doing fine, which is more of a flight-to-conviction, not safety,” Jason Draho, head of asset allocation for the Americas at UBS.
Ok, I’ll bite.
What is bizarre to me is the flight to conviction happening at the same time we see a flight to safety in gold, bonds and utilities.
Furthermore, when the value of the dollar rises, the price of commodities measured in other currencies rises. When raw material prices rise, demand tends to fall.
True, but not true right now.
Not only has gold, silver, sugar and miners risen in the face of the US Dollar, but today so did steel, copper, grains and oil rally in price.
In fact, as per yesterday’s Daily-the flip in the silver to gold ratio suggests inflation will continue to rise.
In the face of a strong dollar, something (equities, commodities or the dollar itself) must give.
The Bollinger Band on the Euro chart also shows that the oversold conditions and come close to the historical low made in 2017 at 100.46.
If we are looking at a shift from confidence in the US Economy to more of a fear of inflation and a decline in equities, keep eyes on this very clear support level for a bounce.
On July 12-13, 2020, I will be speaking/teaching at the Modern Traders Summit in Philadelphia. Only 5 speakers, which means attendees will get a lot of attention, I hope to meet many of you there: https://moderntraderssummit.com/2020-speakers/
S&P 500 (SPY) 335.61 the 10-DMA to hold.
Russell 2000 (IWM) 167.23 the 10-DMA support to hold.
Dow Jones Industrials (DIA) Sitting right on the 10-DMA at 293.58
Nasdaq (QQQ) 232.63 support to hold.
KRE (Regional Banks) Inside day. 56.14 resistance and 54.05 major support.
SMH (Semiconductors) 148.56 support.
IYT (Transportation) Back to unconfirmed bullish phase if holds 195.74
IBB (Biotechnology) 123.48 super pivotal number.
XRT (Retail) Marginal clearance of the 50-DMA making 45.08 pivotal.
Volatility Index (VXX) 14.20 is the first area of interest.
Twitter: @marketminute
The author may have a position in the mentioned securities at the time of publication. Any opinions expressed herein are solely those of the author, and do not in any way represent the views or opinions of any other person or entity.


