

Trading position (short-term; our opinion): Short position with a stop-loss order at $57.86 and the initial downside target at $53.28 is justified from the risk/reward perspective.
Let's take a closer look at the chart below (charts courtesy of www.stooq.com and www.stockcharts.com ) and examine what's the likely crude oil price path ahead.
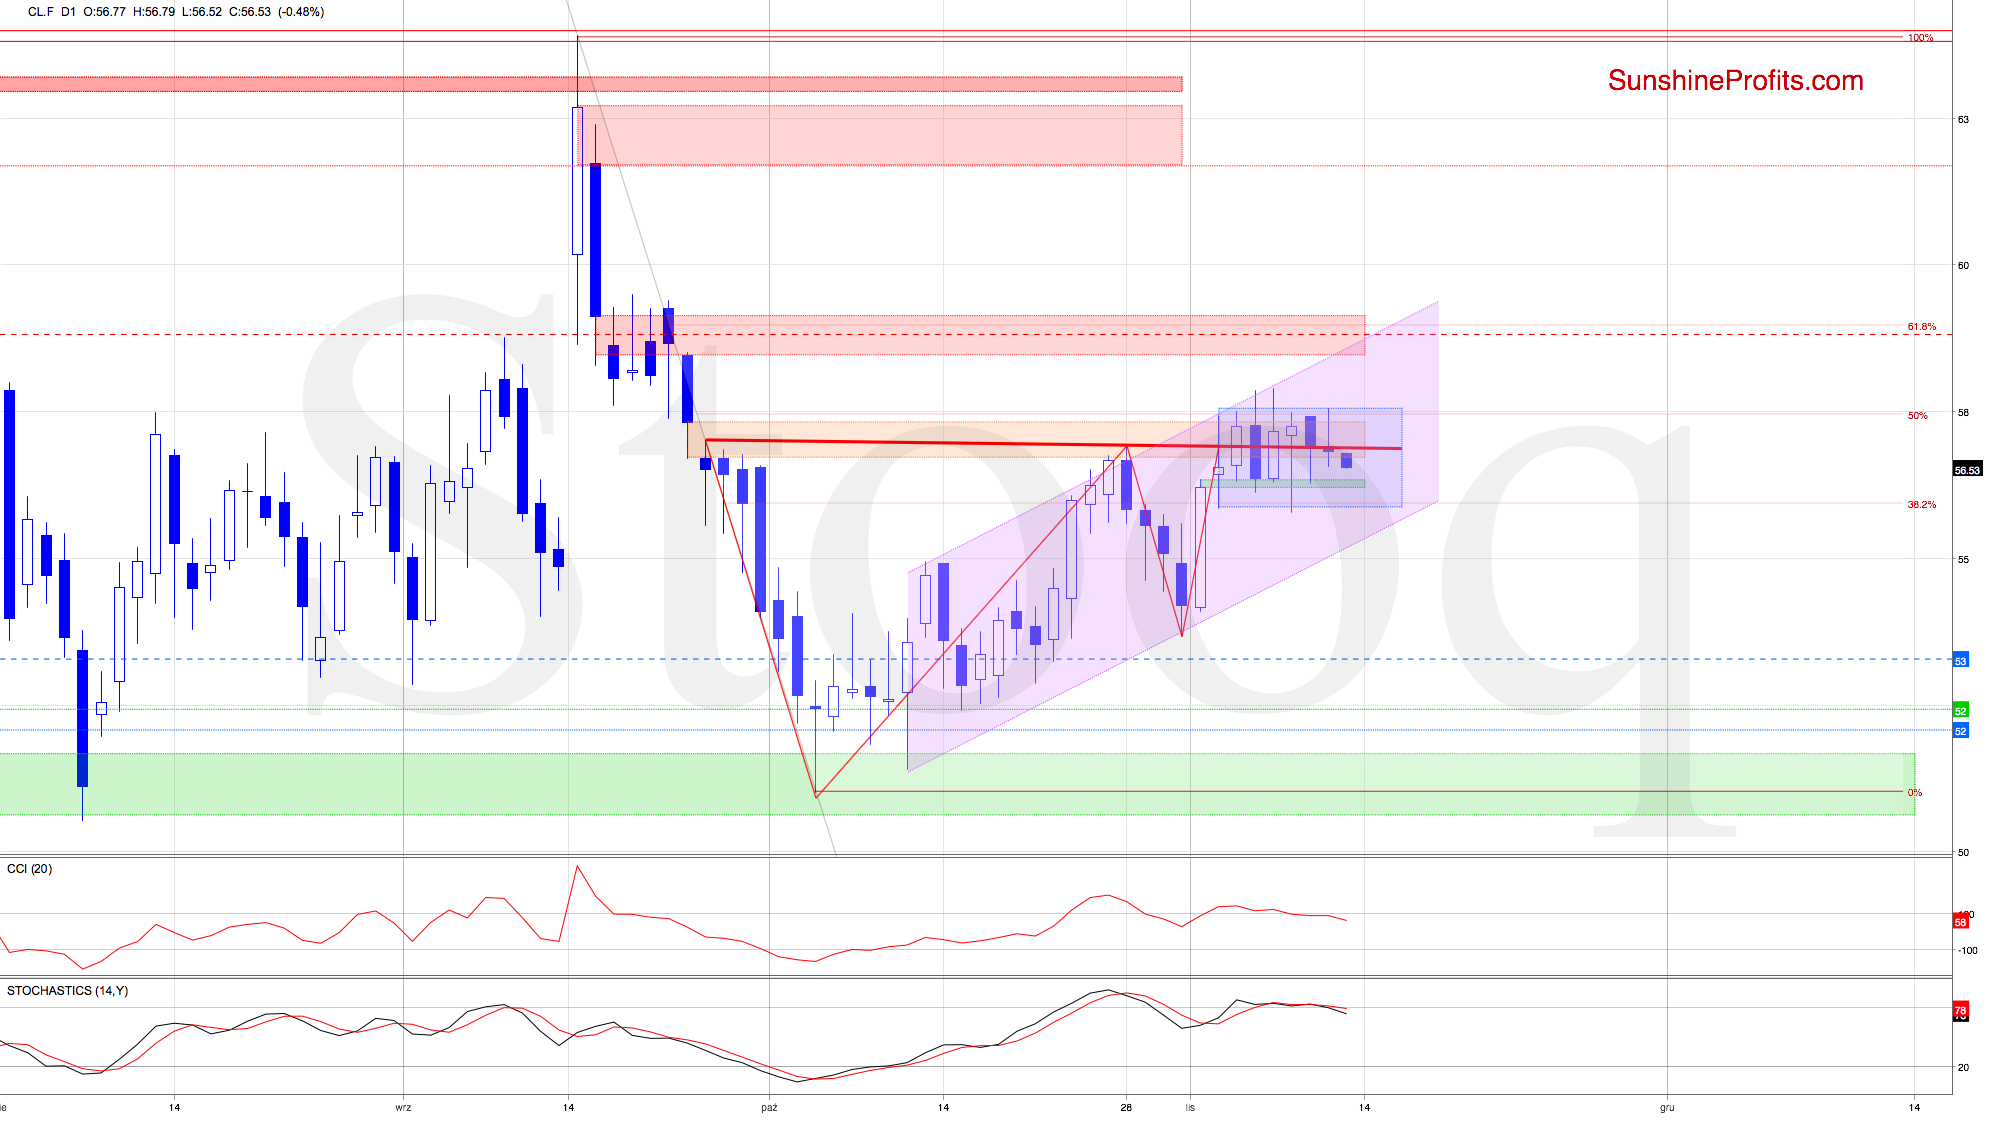
The short-term situation still remains unchanged as black gold keeps trading inside the blue consolidation around the red support/resistance line. Examination of yesterday's price action shows that the bulls failed to break above the upper border of the consolidation or to close the orange gap. As that happened for the 7th time in a row, it doesn't bode well for further rally.
The oil futures closed yesterday below the red line, invalidating yet another earlier breakout attempt. This certainly shows the buyers' weakness, and has already triggered deterioration earlier today. The futures extended losses, increasing the probability of a test of the lower border of the consolidation in the very near future.
Should we see such price action and the breakdown below the lower border of the formation, the next objective for the sellers will be to test of the lower border of the rising purple trend channel.
If they break below this support, the way south targeting at least the late-Oct low would be open.
Let's look at the daily indicators now. Both the CCI and the Stochastic Oscillator generated their sell signals, lending further support to the bears.
Is there a fundamental catalyst on the horizon? In line with our Economic Calendar publication, our eyes are set on the oil inventories to be released tomorrow.
On top of that, the picture emerging from the XOI (the NYSE Arca Oil Index) chart suggests that the next move in the oil market will be to the downside. Let's take a look for the chart below for more details.
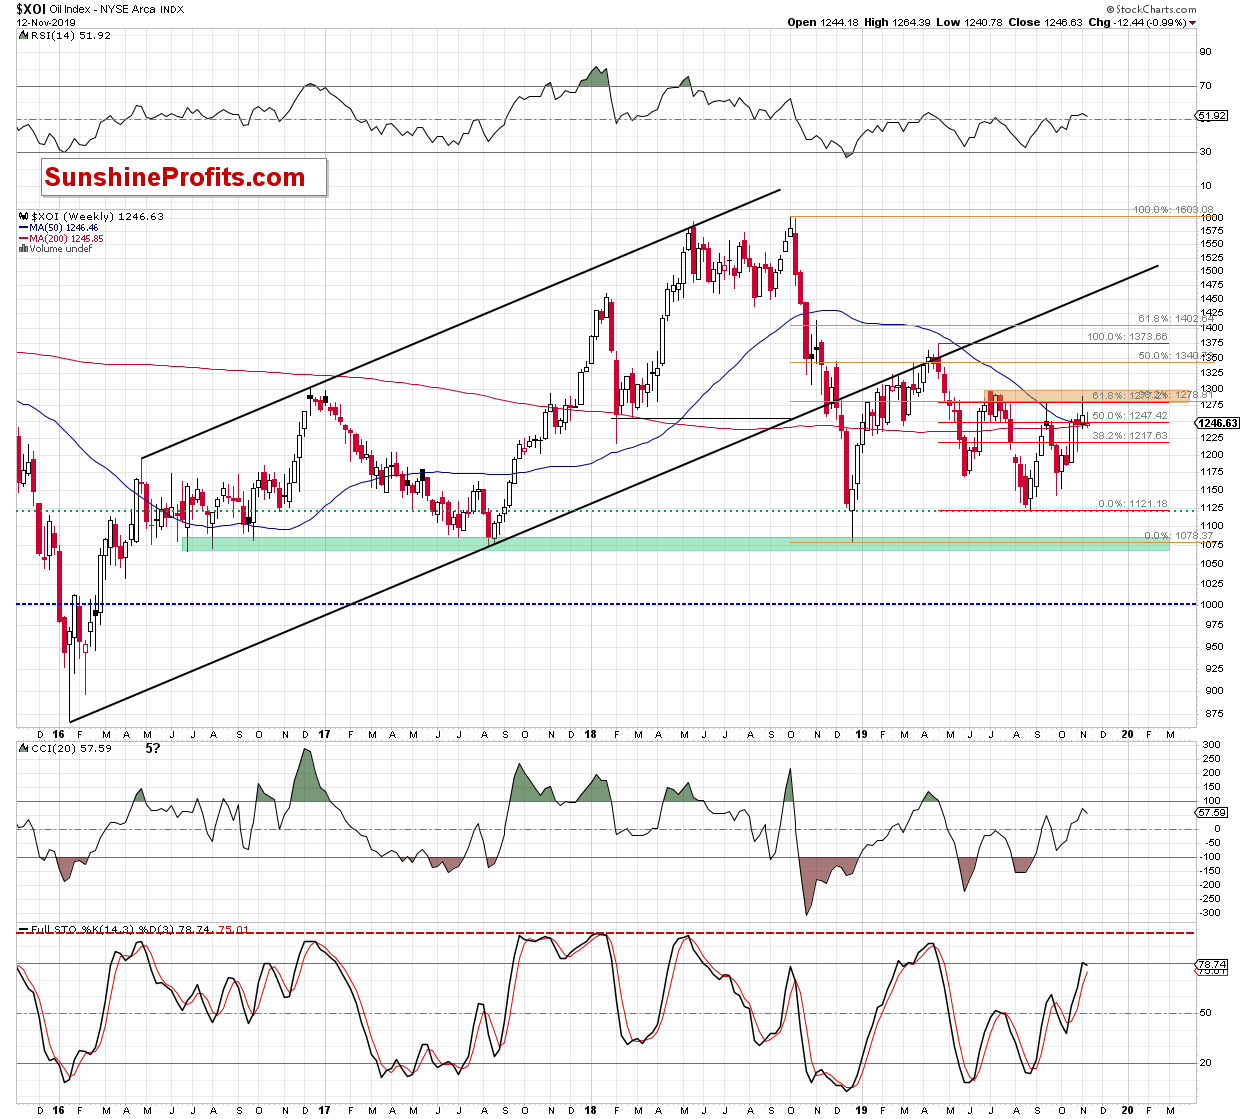
The weekly perspective shows that the index moved to the orange resistance zone in the previous week, but that the bulls didn't manage to break it. This has triggered a pullback before the week was over.
Additionally, XOI failed to break above the 61.8% Fibonacci retracement, which translated into an invalidation of the earlier breakout. As a result, the index created a candlestick with a long upper shadow, which clearly shows where the bears are active at the moment.
Oil stocks went on to open this week with a bearish gap that is seen more clearly on the chart below. Let's see what catches our eye there next.
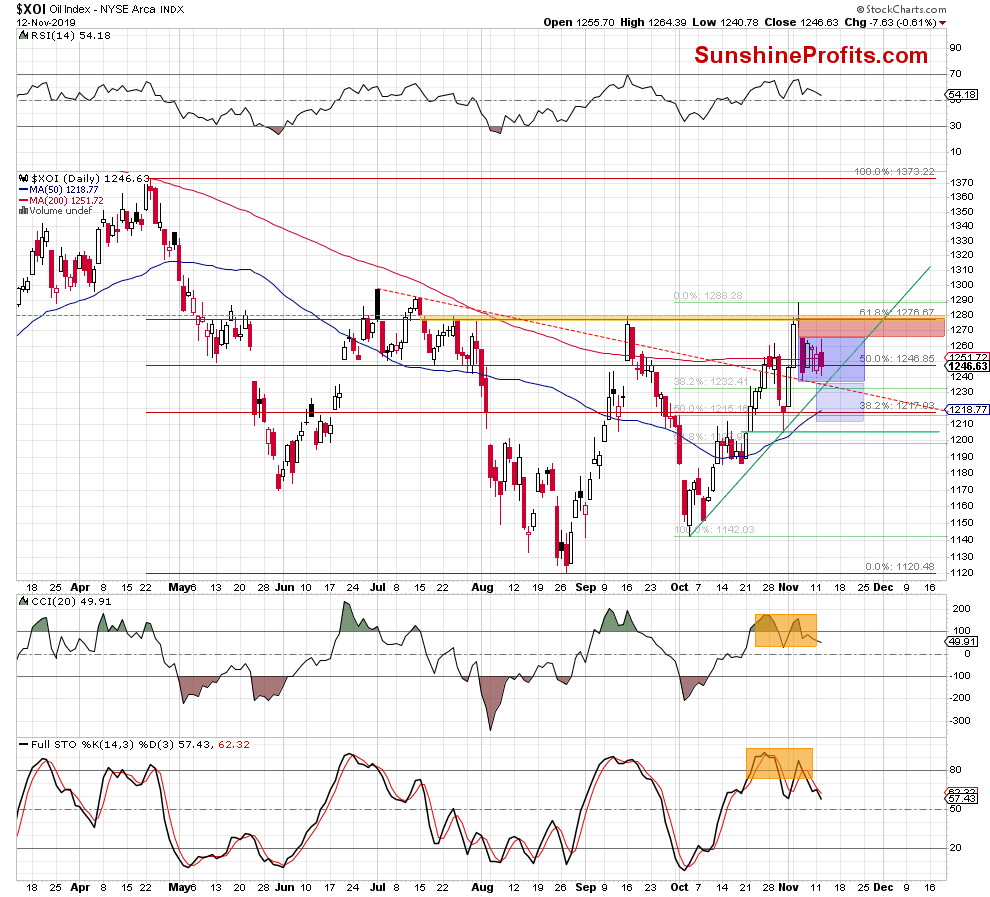
It's the invalidation of the breakout above the late-July and August peaks, the 61.8% Fibonacci retracement and the yellow gap. Such price action is a strongly bearish signal.
The combination of the above-mentioned retracement and the gap was powerful enough to stop the buyers many times in the past since mid-July. It means that as long as the retracement remains unbroken and the gap unclosed, the way to the north is blocked and lower values of the XOI are very likely.
The bearish scenario is even more likely when we take into account the big red gap created at the beginning of the month. It led oil stocks to drop below 1,250, but then they started consolidation. It suggests that the bears rest before theier next push lower.
Will we see lower XOI values?
Taking all the above into account and combining it with the sell signals generated by the indicators, we think that the bearish scenario is very likely - especially if we see a breakdown below the lower border of the blue consolidation and the green support line based on previous lows.
Should we see such price action, the way to at least the late-Oct low, or even the green gap or the 61.8% Fibonacci retracement, will be open.
Summing up, yesterday's oil upswing has fizzled out, and the bears have the initiative today. This is sending oil prices below the orange resistance, the horizontal red line and the 50% Fibonacci retracement. The bears' objectives are closing the green gap and breaking below the lower border of the blue consolidation reinforced by the 38.2% Fibonacci retracement. The short position remains justified.
Trading position (short-term; our opinion): Short position with a stop-loss order at $57.86 and the initial downside target at $53.28 is justified from the risk/reward perspective.
Thank you.
Nadia Simmons
Forex & Oil Trading Strategist

