


Crude Oil Price Highlights:
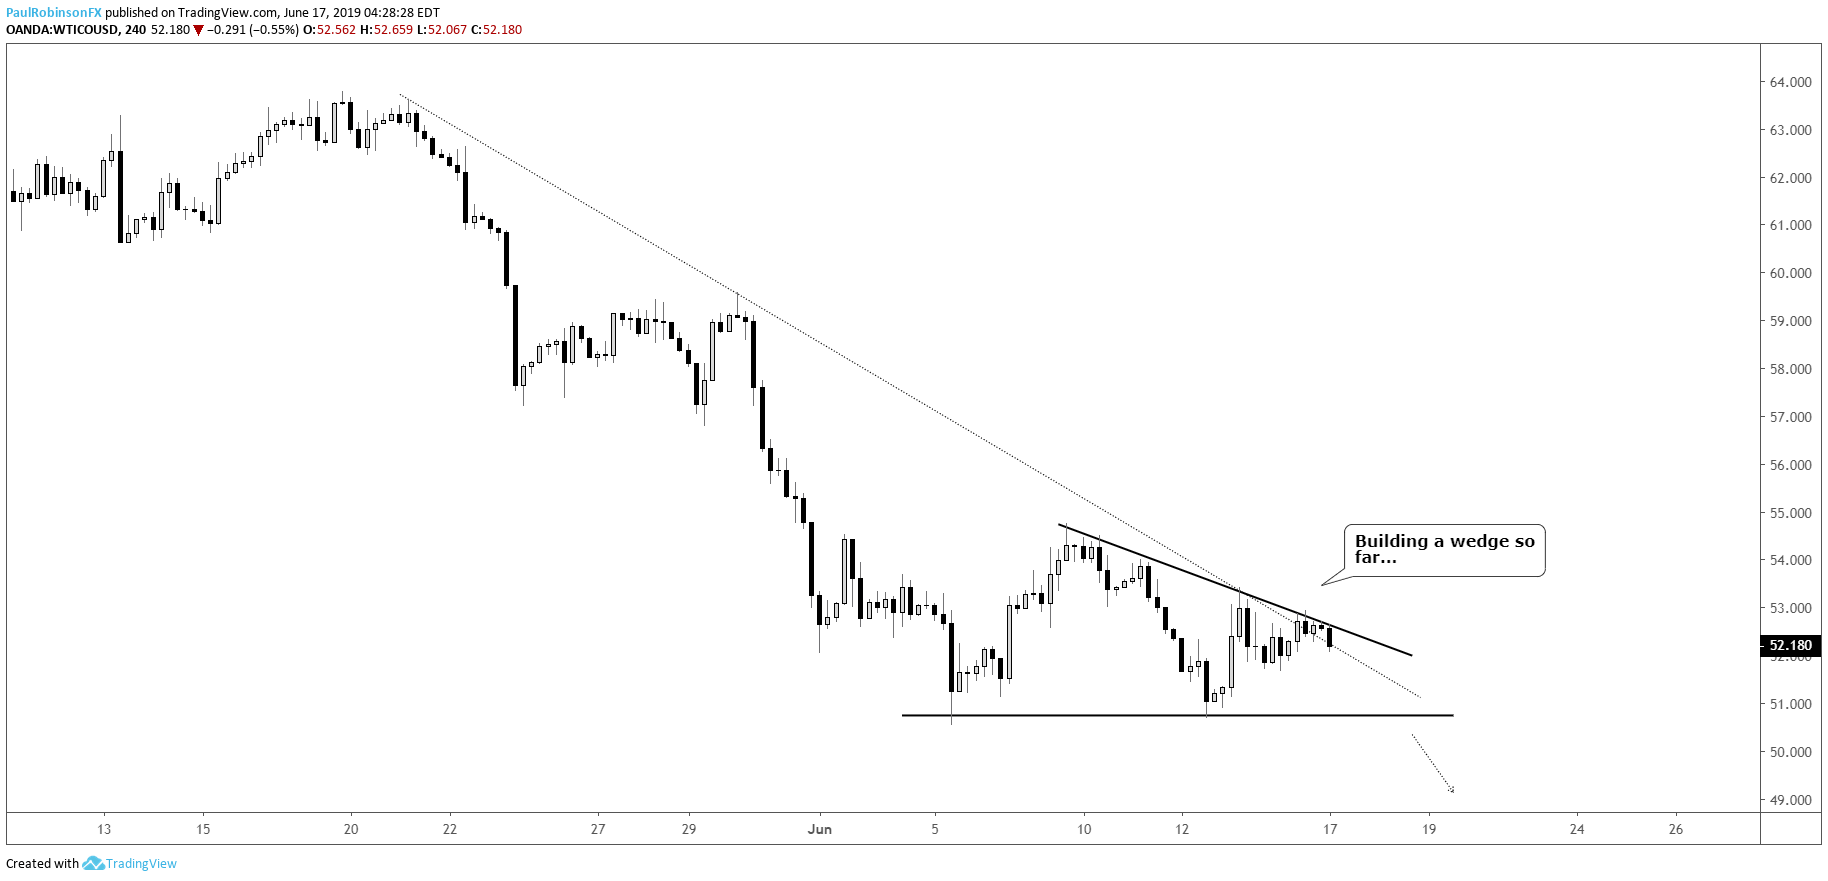
- Crude oil bounce has been weak, wedge could be forming
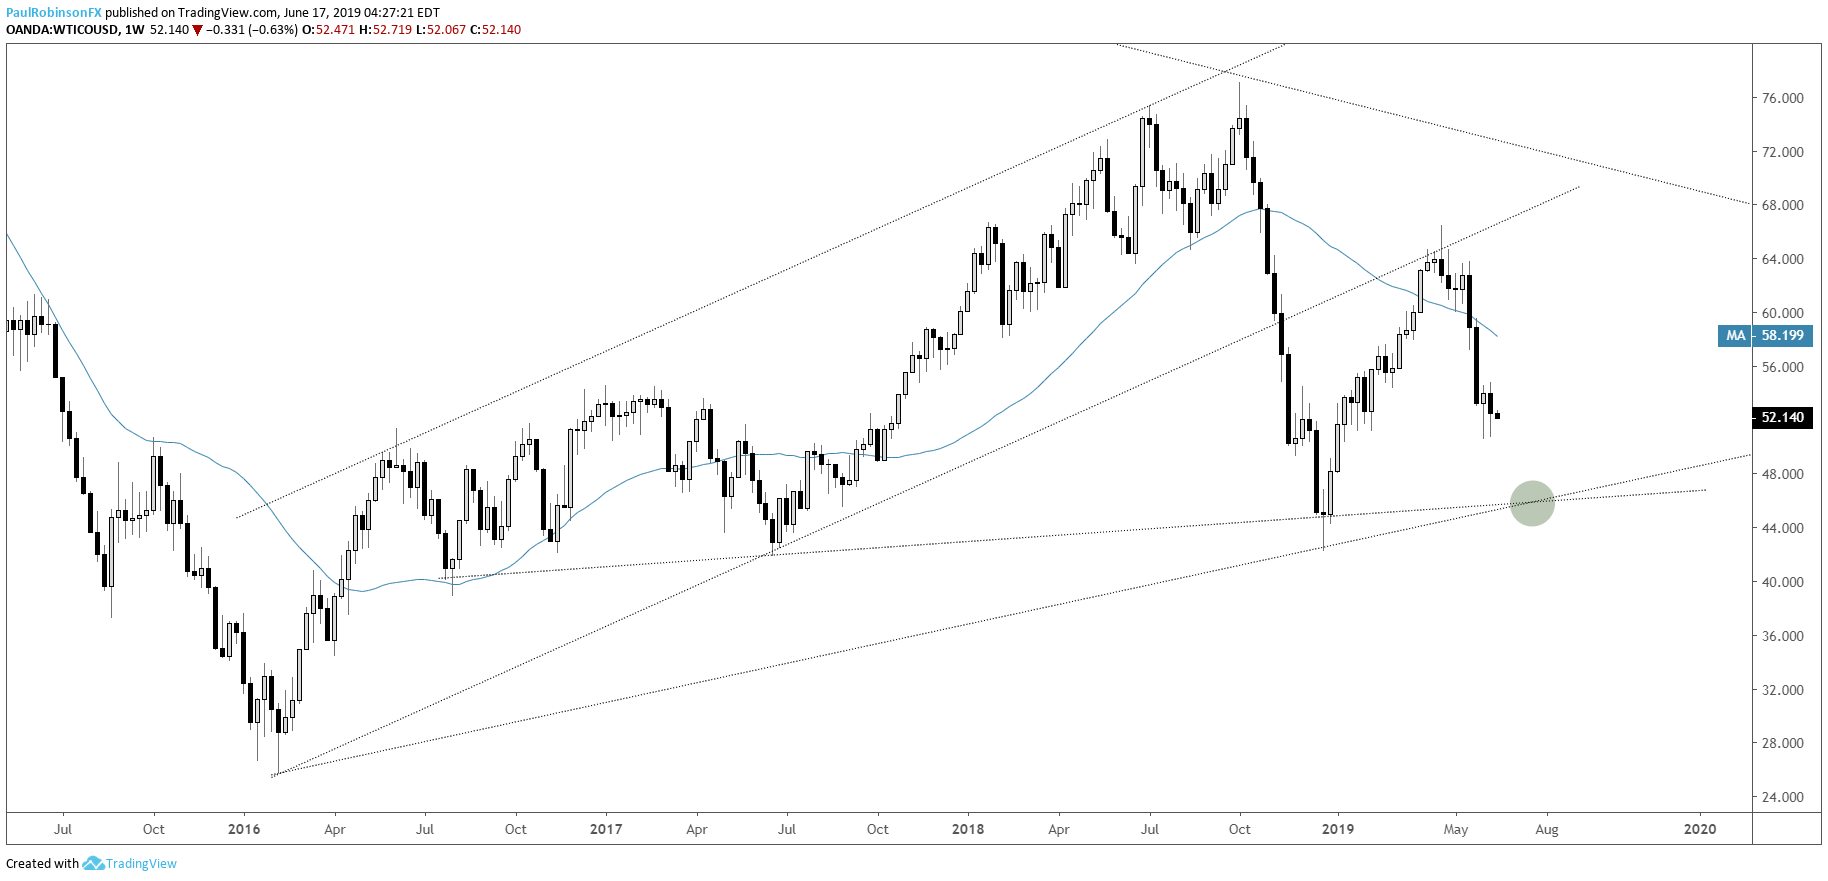
- WTI has room to 46 area before long-term trend-lines
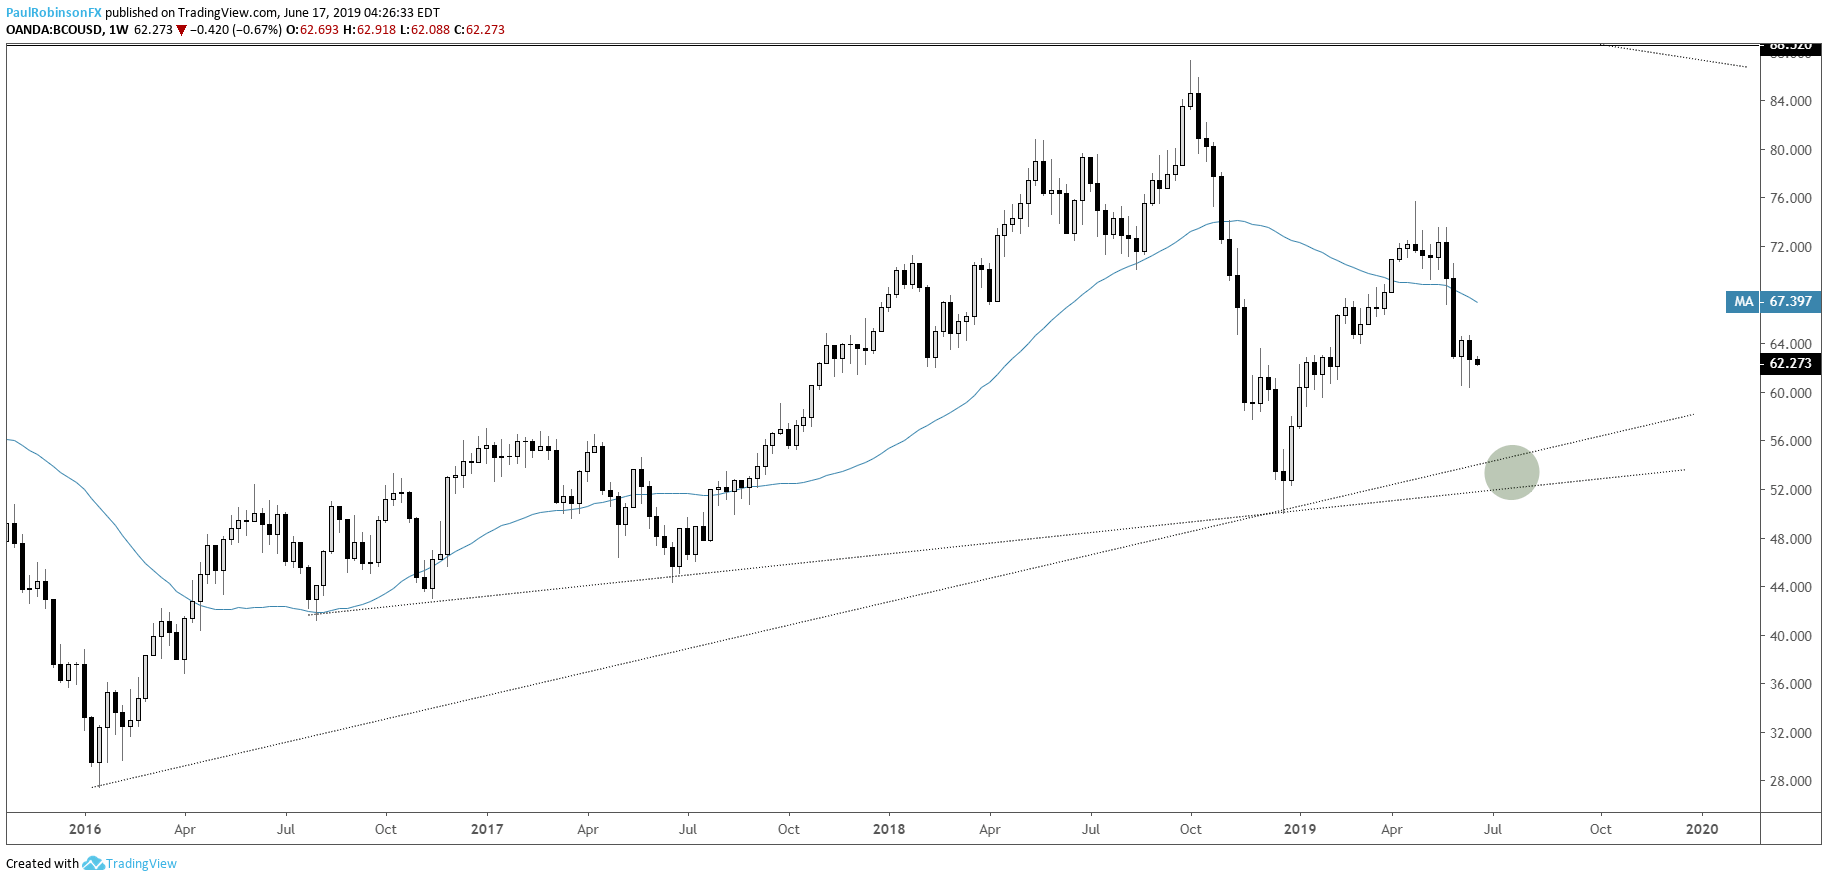
- Brent contract has further to fall before finding similar support
For fundamental and technical forecasts, trade ideas, and educational guides, check out the DailyFX Trading Guides page.
Crude oil bounce has been weak, wedge could be forming
Crude oil continues to be strikingly weak as its relationship to stocks and the ‘risk trade’ has become increasingly untethered. The initial bounce off the June low held some power, but the past couple of sessions after retesting the monthly low the bounce has been smaller.
A turn down from right around here (also the trend-line from last month) will help complete a descending wedge pattern. Given the general trend and nature of the pattern (lower high, flat bottom structure) it is anticipated that a downside break will develop.
A sustained decline through $50.54 should have the WTI contract picking up downside momentum again. The height of the wedge implies about a $4 drop, or about $46. This aligns with the weekly chart, where a confluence of support runs over from 2016.
A failure to roll down and break the $50.54 level will keep the outlook neutral, while some work on the upside will be needed to turn the trading bias bullish. The wedge could develop further and break to the top-side but risk of the breakout failing will be elevated given the generally weak backdrop in place.
WTI Crude Oil Weekly Chart (lines from 2016)
WTI Crude Oil 4-hr Chart (weakening price action)
Brent contract has further to fall before finding similar support
The Brent chart looks similar to WTI, of course, but has further to go before similar support is met. The same trend-lines from 2016 arrive in the vicinity of $55/52. A sustained drop below $60.28 is needed to give sellers traction again.
Brent Crude Weekly Chart (2016 lines down below)
Brent Crude Oil 4-hr Chart (wedge could be building)

Forex & CFD Trader Resources
Whether you are a new or experienced trader, we have several resources available to help you; indicator for tracking trader sentiment, quarterly trading forecasts, analytical and educational webinars held daily, trading guides to help you improve trading performance, and one specifically for those who are new to forex.
---Written by Paul Robinson, Market Analyst
You can follow Paul on Twitter at @PaulRobinsonFX


