
Advertisement
Advertisement
Natural Gas Price Forecast: Eyes on 2.46 Target
By:
Bullish trend persists as natural gas approaches 2.46 target, supported by 50% retracement and 200-Day MA.
In this article:
Natural gas reached a new trend high of 2.42 on Wednesday as the bull trend persists. It is rapidly approaching the next higher target of 2.46. That is where the 200-Day MA and 50% retracement resides. The 200-Day line is a significant trend indicator, and this is the first approach since the price of natural gas dropped below the 200-Day MA in late-January. Therefore, it expected that resistance will be seen around that line, enough to turn prices back down. A little higher is the 50-Week MA at 2.49
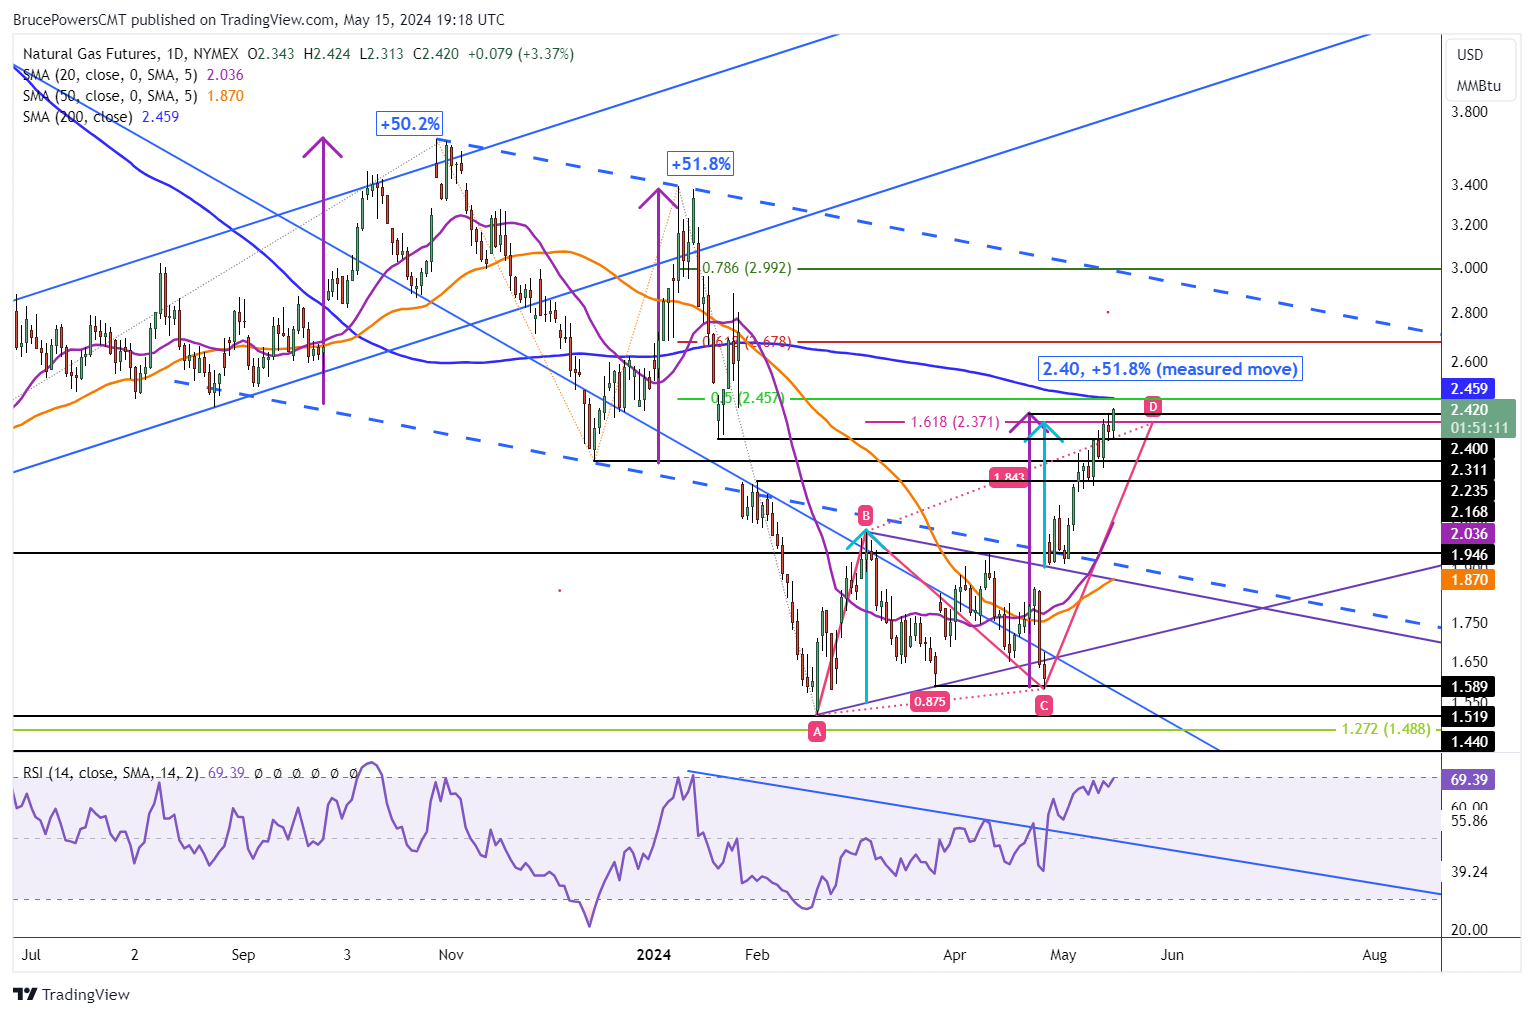
Drop Below 2.31 Points to Retracement
A retracement is first indicated on a drop below today’s low of 2.31. Prior swing highs and lows then mark possible support levels starting with 2.23, which was a swing low in December. Then the level is a little lower at 2.21, followed by 2.18. This is the fourth consecutive week of positive performance for natural gas. Although the week is not over, it is currently trading near the highs of the day, and it is well on track to hit the 2.46 target zone. The 20-Day MA is a way lower at 2.04. It wouldn’t be surprising to see the 20-Day line tested as support if a retracement does come.
Key 2.46 Pivot Approached
Although the 2.46 price area is a key pivot, price action will leave clues as to what might be coming. Given the strength of the advance so far, might natural gas be able to breakout above the 200-Day line? Given the confluence of indicators highlighting a resistance zone from 2.37 to 2. 49, an upside breakout seems less likely, but it is possible. Or a brief consolidation and/or retracement could follow a test of the 200-Day line.
In this case, natural gas would be heading up towards the 61.8% Fibonacci retracement level. The 78.6% Fibonacci retracement follows. Also, a rise to test the top channel line could be in the works. If reached today the top channel line would match the 78.6% retracement level. Let’s watch the reaction of price upon approaching the 200-Day line for further insights.
For a look at all of today’s economic events, check out our economic calendar.
About the Author
Bruce Powersauthor
Bruce boasts over 20 years in financial markets, holding senior roles such as Head of Trading Strategy at Relentless 13 Capital and Corporate Advisor at Chronos Futures. A CMT® charter holder and MBA in Finance, he's a renowned analyst and media figure, appearing on 150+ TV business shows.
Did you find this article useful?
Latest news and analysis


Advertisement