
Advertisement
Advertisement
Natural Gas Price Forecast: Eyes on 200-Day Moving Average at 2.46
By:
Upward momentum in natural gas remains strong, targeting 200-Day MA at 2.46, but a pullback is possible after completing another target at 2.40 today.
In this article:
Natural gas advances to a new trend high of 2.40 on Tuesday and hits the initial target from a measured move. Upward momentum still looks constructive as the day’s trading range is relatively narrow and positioned in the upper zone of Monday’s range. If natural gas manages to end today’s session above yesterday’s high of 2.38, it will be in a slightly stronger position than if the close occurs below that high.
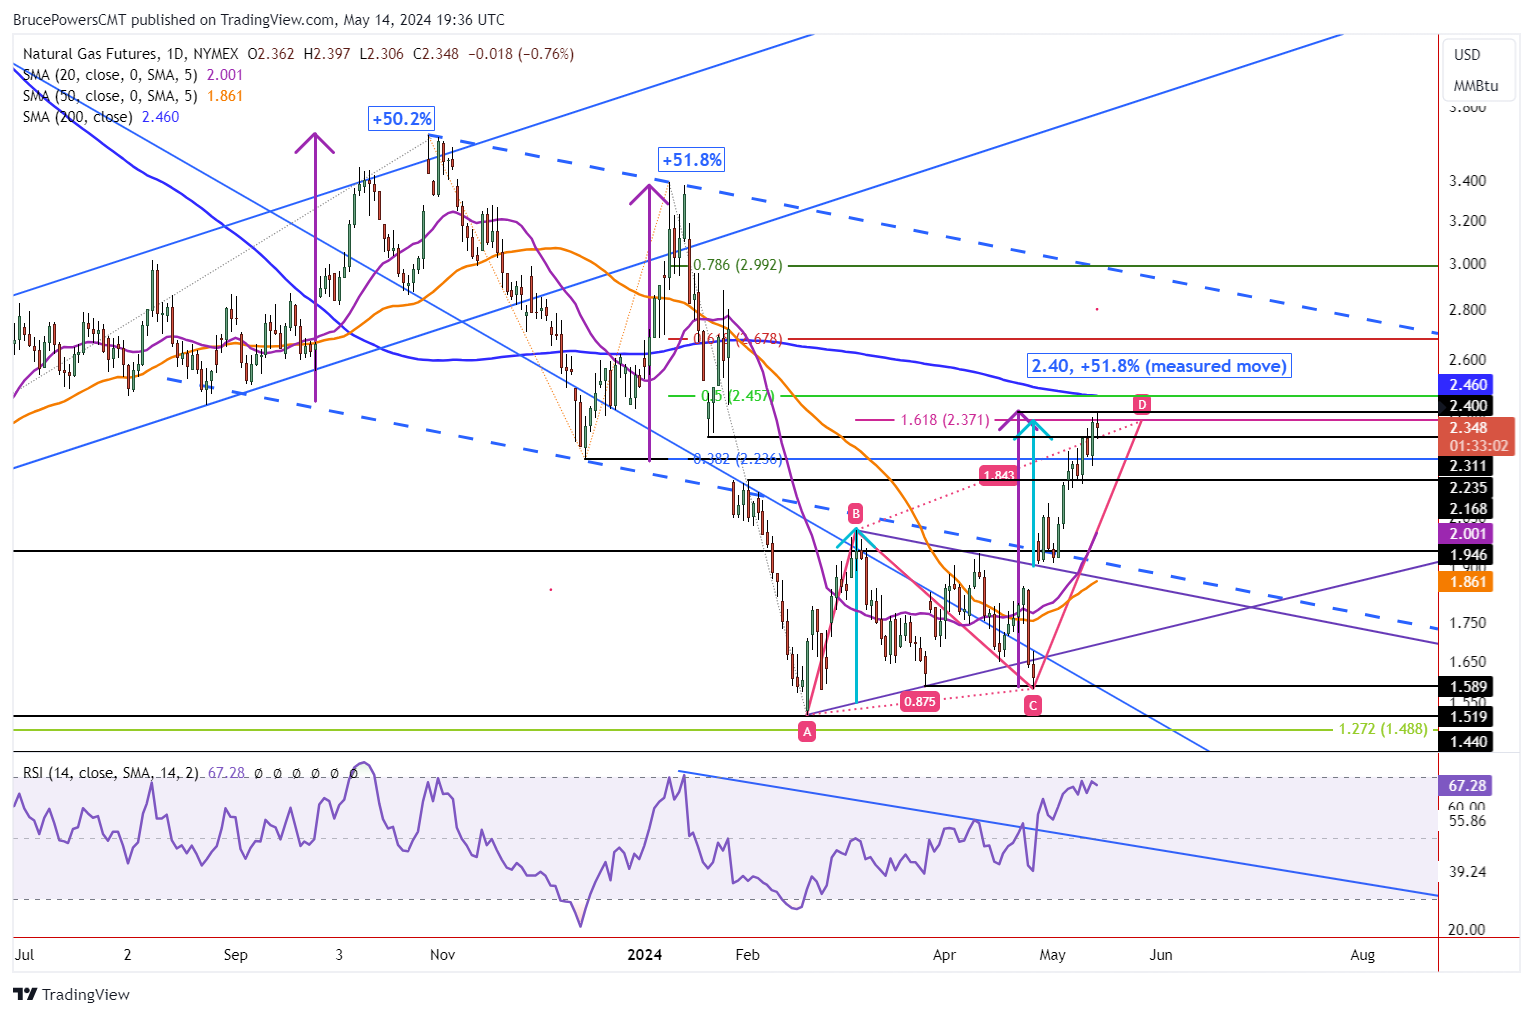
200-Day Line at 2.46 is Next Target
The next target zone is the 200-Day MA at 2.46. It is strengthened by the 50% retracement, which marks the same price. Natural gas is well on its way to that target, and it continues to have a good chance of being reached before resistance stops the ascent, possibly leading to a pullback. Further, the 50-Week MA (not shown) is slightly above the 200-Day line at 2.49. If the completion of the measured move at today’s high doesn’t end the ascent, a 2.46 to 2.48 target zone should be next on the agenda.
First Approach to 200-Day Line Could See Strong Resistance
It is common for price to be rejected from a long-term moving average the first time it is approached after being away from it for a while. Following the January 25 internal swing high natural gas dropped below the 200-Day line and accelerated to the downside.
The current rally is the first attempt since then to test the 200-Day line as resistance. However, if natural gas manages to break through the 200-Day line and the 50-Week line, and then stays above them, it would next be heading towards the 61.8% Fibonacci retracement at 2.68. Depending on when reached, the upper declining blue dashed channel line may have an impact as the channel line and 61.8% level may be near each other.
Near-term Support at 2.31
If instead of continuing to ascend, today’s high leads to a retracement, the first sign of it would be on a drop below today’s low of 2.31. The prior swing low and 38.2% retracement at 2.24 would the be the next lower possible support zone. Other price levels will be looked at in the future if the pullback scenario unfolds.
For a look at all of today’s economic events, check out our economic calendar.
About the Author
Bruce Powersauthor
Bruce boasts over 20 years in financial markets, holding senior roles such as Head of Trading Strategy at Relentless 13 Capital and Corporate Advisor at Chronos Futures. A CMT® charter holder and MBA in Finance, he's a renowned analyst and media figure, appearing on 150+ TV business shows.
Did you find this article useful?
Latest news and analysis


Advertisement