
Advertisement
Advertisement
Natural Gas Price Forecast: Testing Support Following Earlier Breakout
By:
Natural gas tests support near triangle top, with potential for higher demand as price volatility declines.
In this article:
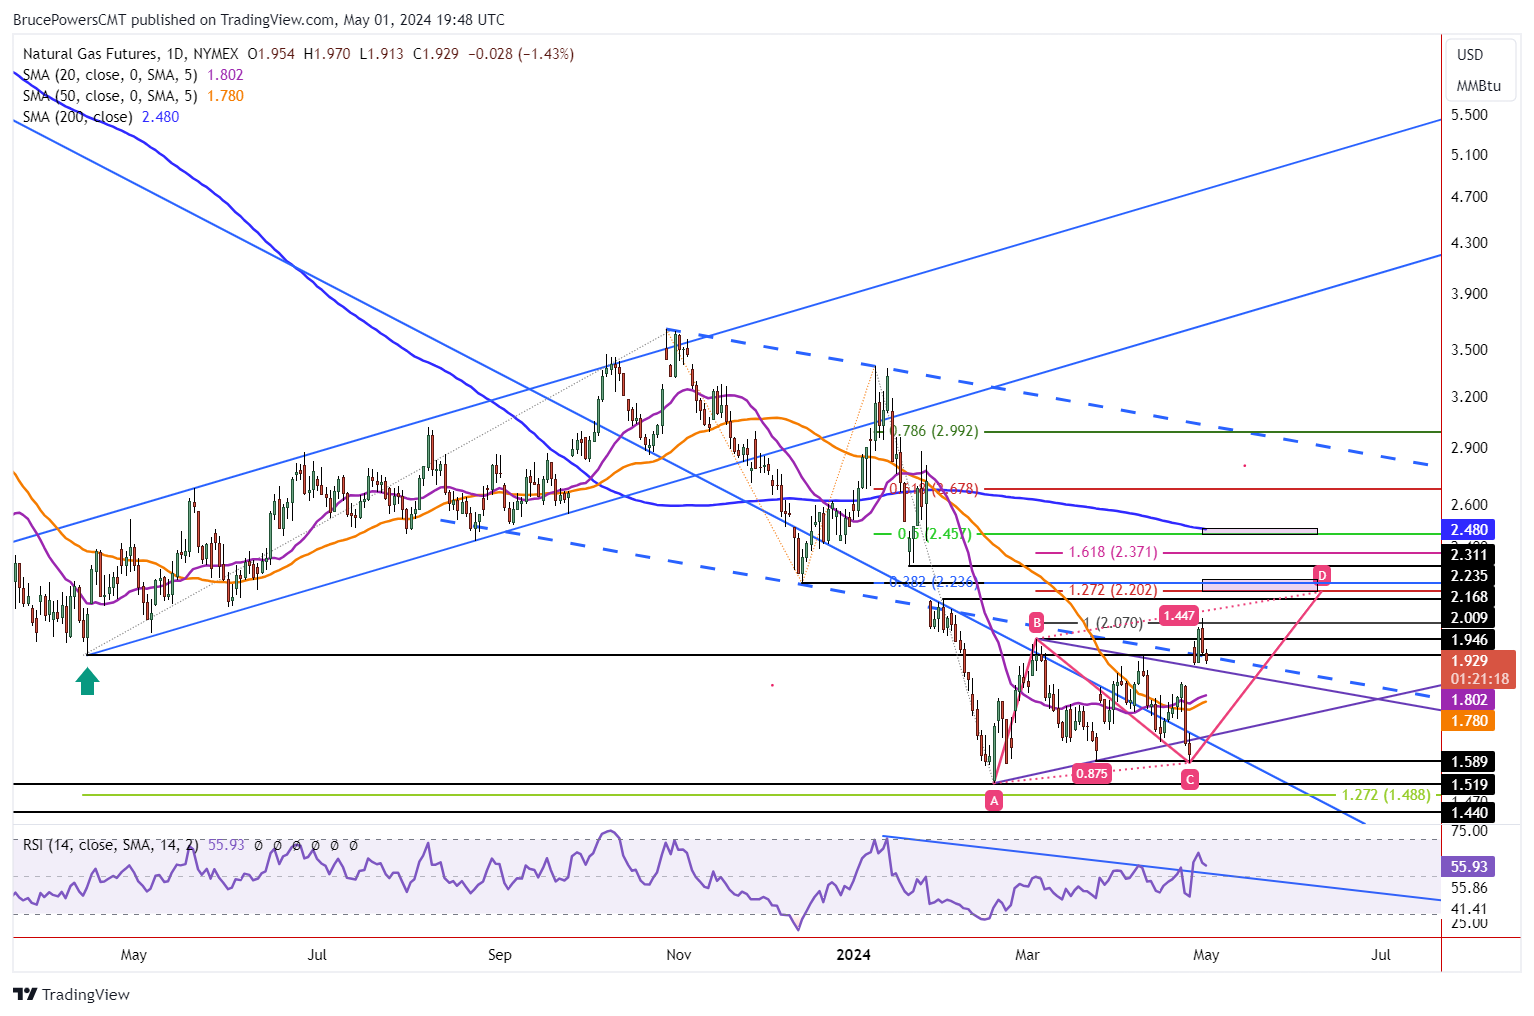
Natural gas pulls back again to test recent support around the top trendline of a symmetrical triangle bottom consolidation pattern. Today’s low was 1.91 and the four-day low was also 1.91. Tuesday’s high of 2.09 was the highest price for natural gas since February 7 and indicates that demand may be improving overall. Characteristics of the pullback should provide clues as to what might be coming. In summary, either a deeper pullback that sees trading happening lower within the triangle pattern, or a short pause before the trend continues higher.
20-Day Crossed Above 50-Day for Early Bullish Indication
The 20-Day MA recently crossed back above the 50-Day after being below it since early December, other than for a brief time in late-January. However, it hasn’t yet moved away from the 50-Day MA, reflecting the current pause in bullish momentum. It will become more useful if it rises away from the 50-Day line or falls back below.
Narrow Range Day Sets Up Possible Breakout
Today is on track to end with a relatively narrow range day as volatility declines. It sets up the potential for a spike in volatility tomorrow, either up or down. At the time of this writing, the day’s high is at 1.97 and the low is at 1.91. But caution is warranted on the downside as the top boundary line of the triangle may continue to act as support and it is slightly below today’s low.
If the price of natural gas does fall through the top line and continues to drop the area around the most recent swing high of 1.85 would be an area of interest for buyers. Slightly lower is potential support around the 20-Day MA at 1.80 and the 50-Day line at 1.78. After that, the lower boundary line of the triangle is the final support zone before another bearish breakdown would trigger.
Rise Above Week’s High of 2.09 to Provide Sign of Strength
A decisive advance above today’s high will show strength but it won’t be confirmed until there is a sustainable rally above Tuesday’s high of 2.09, also this week’s high. If that happens before a deeper pullback, natural gas first targets the completion of a rising ABCD pattern with the CD leg extended by 127.2% of the AB leg. An initial target reflecting price symmetry between the two legs of the pattern was reached yesterday at 2.07.
For a look at all of today’s economic events, check out our economic calendar.
About the Author
Bruce Powersauthor
Bruce boasts over 20 years in financial markets, holding senior roles such as Head of Trading Strategy at Relentless 13 Capital and Corporate Advisor at Chronos Futures. A CMT® charter holder and MBA in Finance, he's a renowned analyst and media figure, appearing on 150+ TV business shows.
Did you find this article useful?
Latest news and analysis


Advertisement