
Advertisement
Advertisement
Natural Gas Price Forecast: Current Patterns and Potential Price Targets
By:
Natural gas has exceeded its first target in a rising ABCD pattern, with trading now eyeing a test of support in a declining channel. Recent highs suggest the potential for further price increases.
In this article:
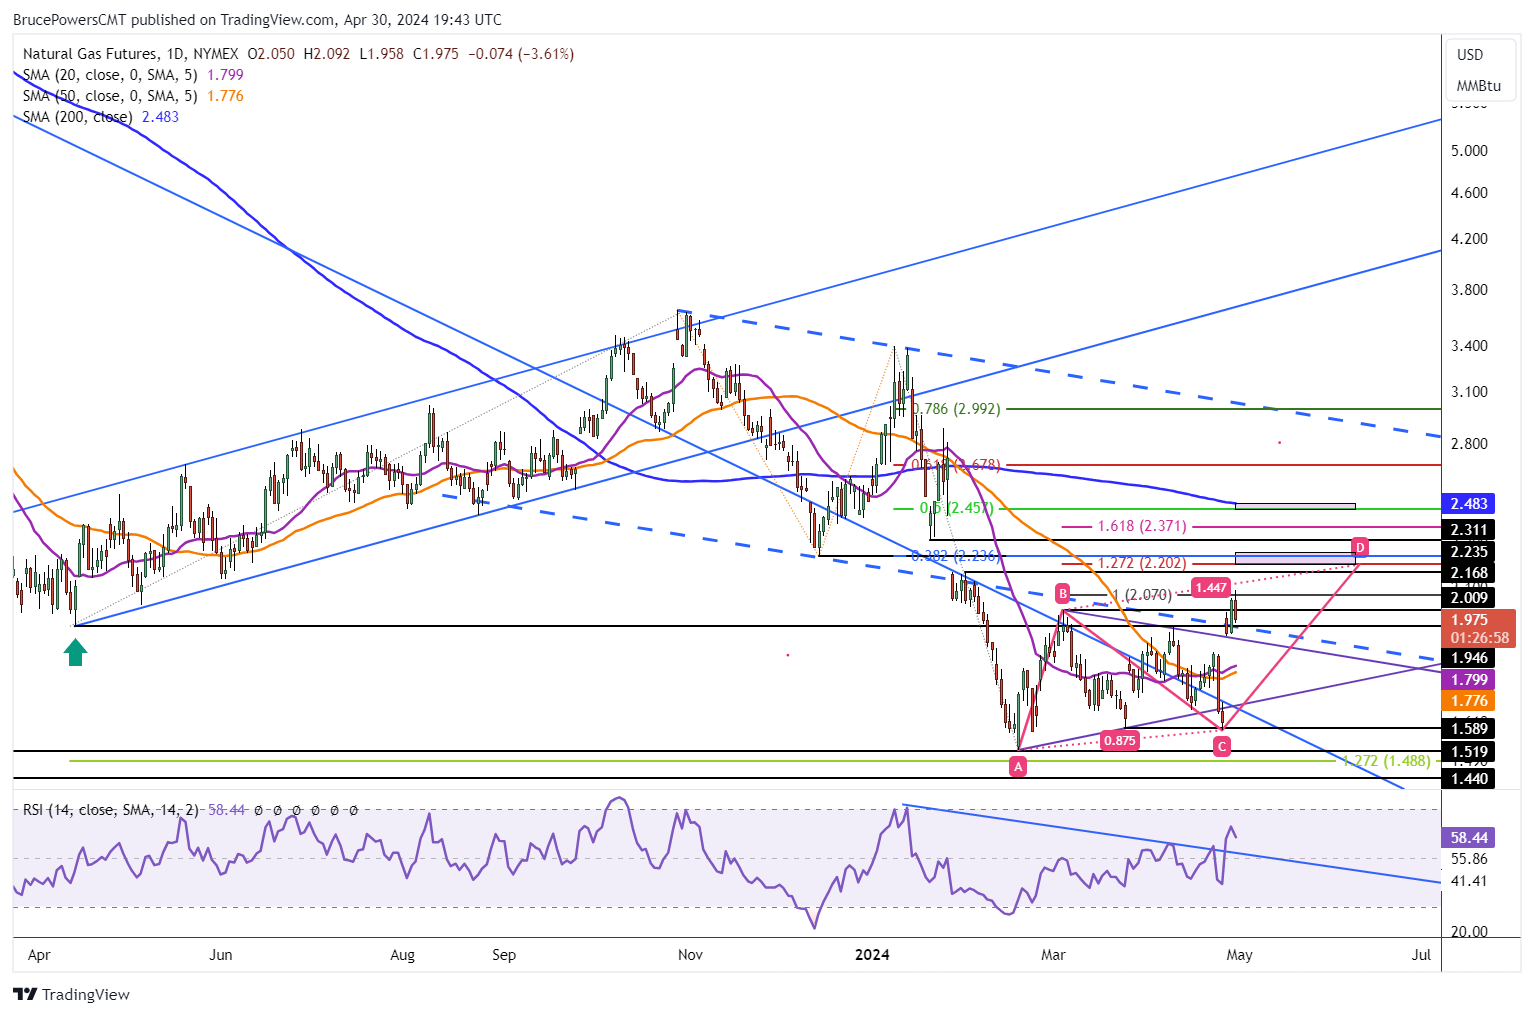
Natural gas exceeded its first target today at the completion of a rising ABCD pattern. The high for Tuesday is 2.09 and the pattern target was 2.07. Resistance was seen off the high and trading is happening at the lows of the day at the time of this writing. It looks like a test of support at the lower declining blue dashed parallel channel may be in the works.
The April 14 swing low of 1.95 can be used as a proxy for the line if reached today as it is crossing the dashed line. Otherwise, watch for support at or above the top boundary line (purple) of the symmetrical triangle bottom. The three-day low of 1.91 can be used as a proxy for the line, however, keep in mind that the line will represent a lower price in the future given its downward slope.
Highest Daily Closing Price in 59 Days
On Monday natural gas ended the session at its highest daily closing price in 59 days. Along with today’s new recent high, it looks like it is telegraphing higher prices. If it continues to rise, and there is a good chance it will, the next higher ABCD pattern target is up at 2.20. That price is within a target zone from around 2.17 to 2.24 and it includes the 38.2% Fibonacci retracement at 2.24.
Further up is the price area around the 200-Day MA at 2.48. Notice that the moving averages are showing improving demand. Recently, the purple 8-Day MA crossed up through the orange 50-Day MA after being below it for some months. Further, the relative strength index momentum oscillator (RSI) recently broke a trendline to the upside.
Below 1.91, Likely Leads to Test of Support Lower Down
Ideally for the bulls, natural gas stays above the April 26 gap day low support price of 1.91 during retracements. If so, the above bullish case becomes more likely and may occur faster than otherwise. However, if the 1.91 price level fails to act again as support and is broken to the downside, a test of lower price levels becomes likely. Lower meaning, from 1.90 to the 1.61 closing price from the day before the gap. The April 23 high of 1.85 and the 20-Day and 50-Day MAs from 1.80 to 1.78 are two price areas that stand out.
For a look at all of today’s economic events, check out our economic calendar.
About the Author
Bruce Powersauthor
Bruce boasts over 20 years in financial markets, holding senior roles such as Head of Trading Strategy at Relentless 13 Capital and Corporate Advisor at Chronos Futures. A CMT® charter holder and MBA in Finance, he's a renowned analyst and media figure, appearing on 150+ TV business shows.
Did you find this article useful?
Latest news and analysis


Advertisement