
Advertisement
Advertisement
Navigating Natural Gas: Unraveling Trends and Future Prospects
By:
Natural gas faces a critical juncture, testing support at 2.235 and signaling potential exhaustion. Traders await signs of strength amid heightened volatility for a decisive market move.

In this article:
Natural Gas Forecast Video for 23.01.24 by Bruce Powers
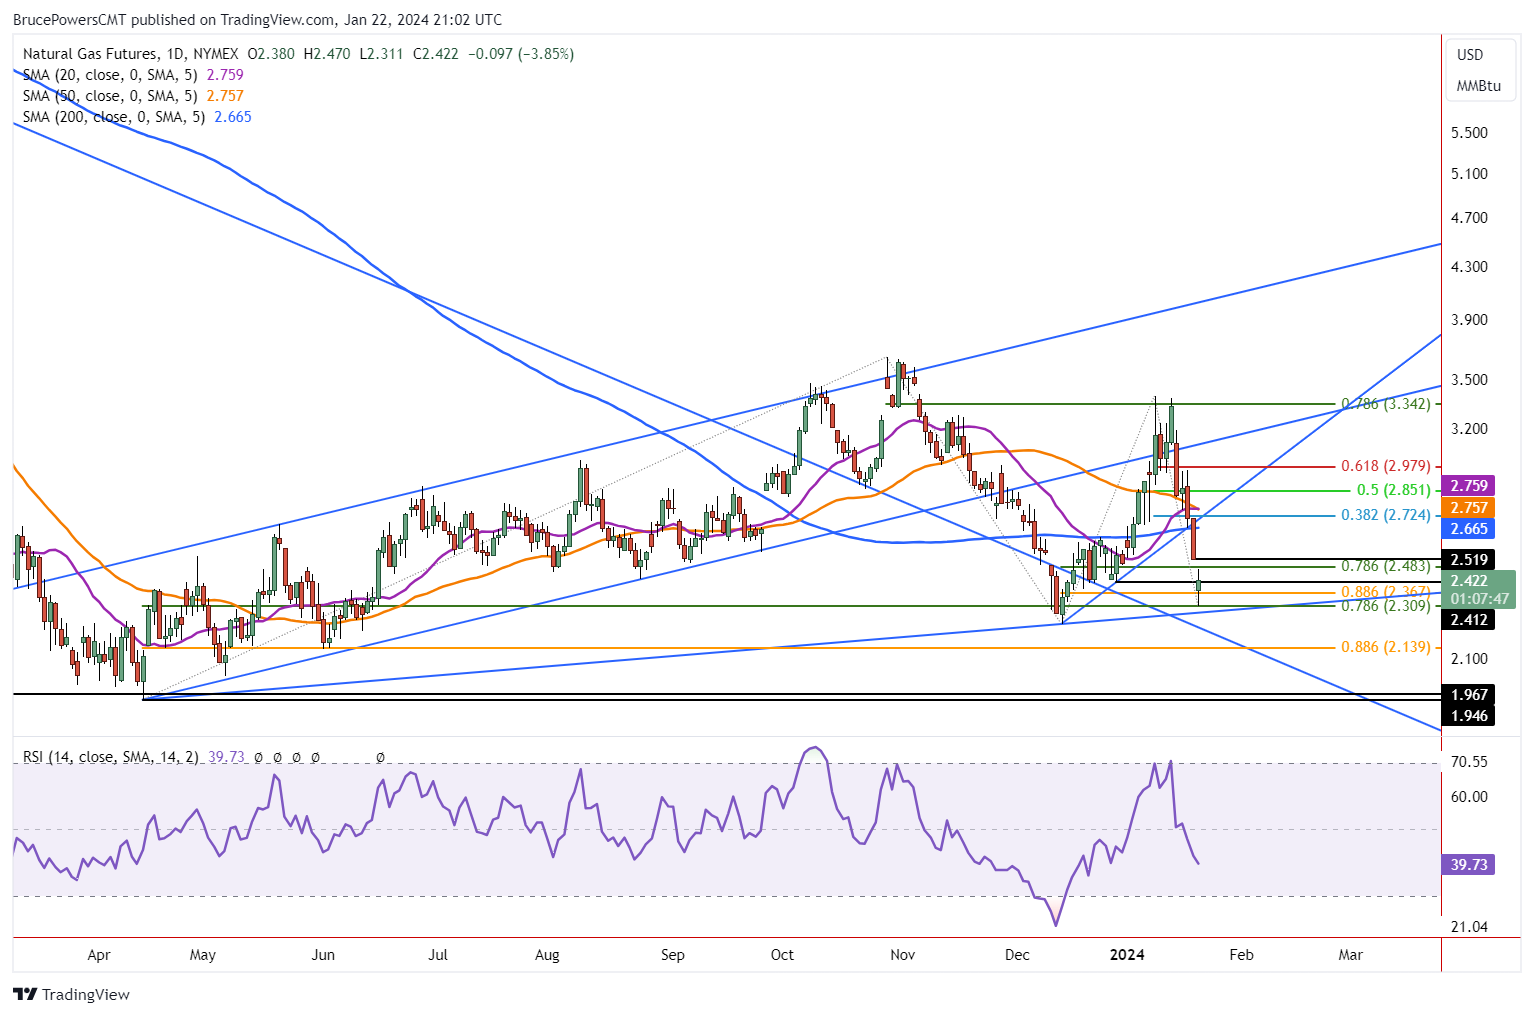
Natural gas falls hard once again, dropping to a new retracement low on a gap opening for the week. The recent swing low of 2.235 was tested as support with day’s low of 2.31. That was right around the 78.6% retracement of the full advance starting from the April 2023 swing low. Support was subsequently seen near the low, leading to an intraday rally. Natural gas is on track to close higher than the open and in the top half of the day’s range.
Might Gap Imply Exhaustion?
Certainly, the gap today may turn out to be an exhaustion gap signaling the end of the correction. However, we first need to see signs of strength. Nevertheless, downward momentum started five days ago. If natural gas falls further towards or below the 2.235 December swing low, it should run out of momentum before going much lower. The 88.6% Fibonacci retracement of the full uptrend comes in at 2.14. That would be a lower target if the December swing low fails to hold the decline.
Test of 200-Day Line at 2.67 Targeted Following Bullish Reversal
Given today’s relatively wide range, it wouldn’t be surprising to see an inside day tomorrow as natural gas continues to try and determine its next move. Until then a rise above today’s high of 2.47 shows demand increasing with a gap fill likely. That happens at yesterday’s low of 2.51. Assuming today’s low holds and is followed by a bullish reversal, a test of the 200-Day line as resistance around 2.665 looks to be a minimum likely advance. And it is quickly followed by the 38.2% Fibonacci retracement at 2.72.
Volatility Higher as Recent Swings are Over 30% Each
The trend in natural gas is down and lower price levels are at risk of being tested as support. Further bearish confirmation may be provided soon as the shorter 50-Day MA (orange) is about to drop below the 20-Day MA. However, if a rally comes in the next few days, it may not be able to stay below the 20-Day line. Volatility has picked up since the October 2023 high and we should expect it to continue into the near future. This means that the next rally may also have a wide swing. The price of natural gas has fallen by 31.9% in the current correction as of today low, while the prior two swings saw moves of 51.8% and 38.7%, respectively.
For a look at all of today’s economic events, check out our economic calendar.
About the Author
Bruce Powersauthor
Bruce boasts over 20 years in financial markets, holding senior roles such as Head of Trading Strategy at Relentless 13 Capital and Corporate Advisor at Chronos Futures. A CMT® charter holder and MBA in Finance, he's a renowned analyst and media figure, appearing on 150+ TV business shows.
Did you find this article useful?
Latest news and analysis


Advertisement