
Advertisement
Advertisement
Natural Gas Signals Bullish Momentum, Eyes 3.04 Price Target
By:
Natural gas showcases intraday resilience, signaling a bullish move towards the 161.8% extended ABCD pattern target at 2.94.

In this article:
Natural Gas Forecast Video for 09.01.24 by Bruce Powers
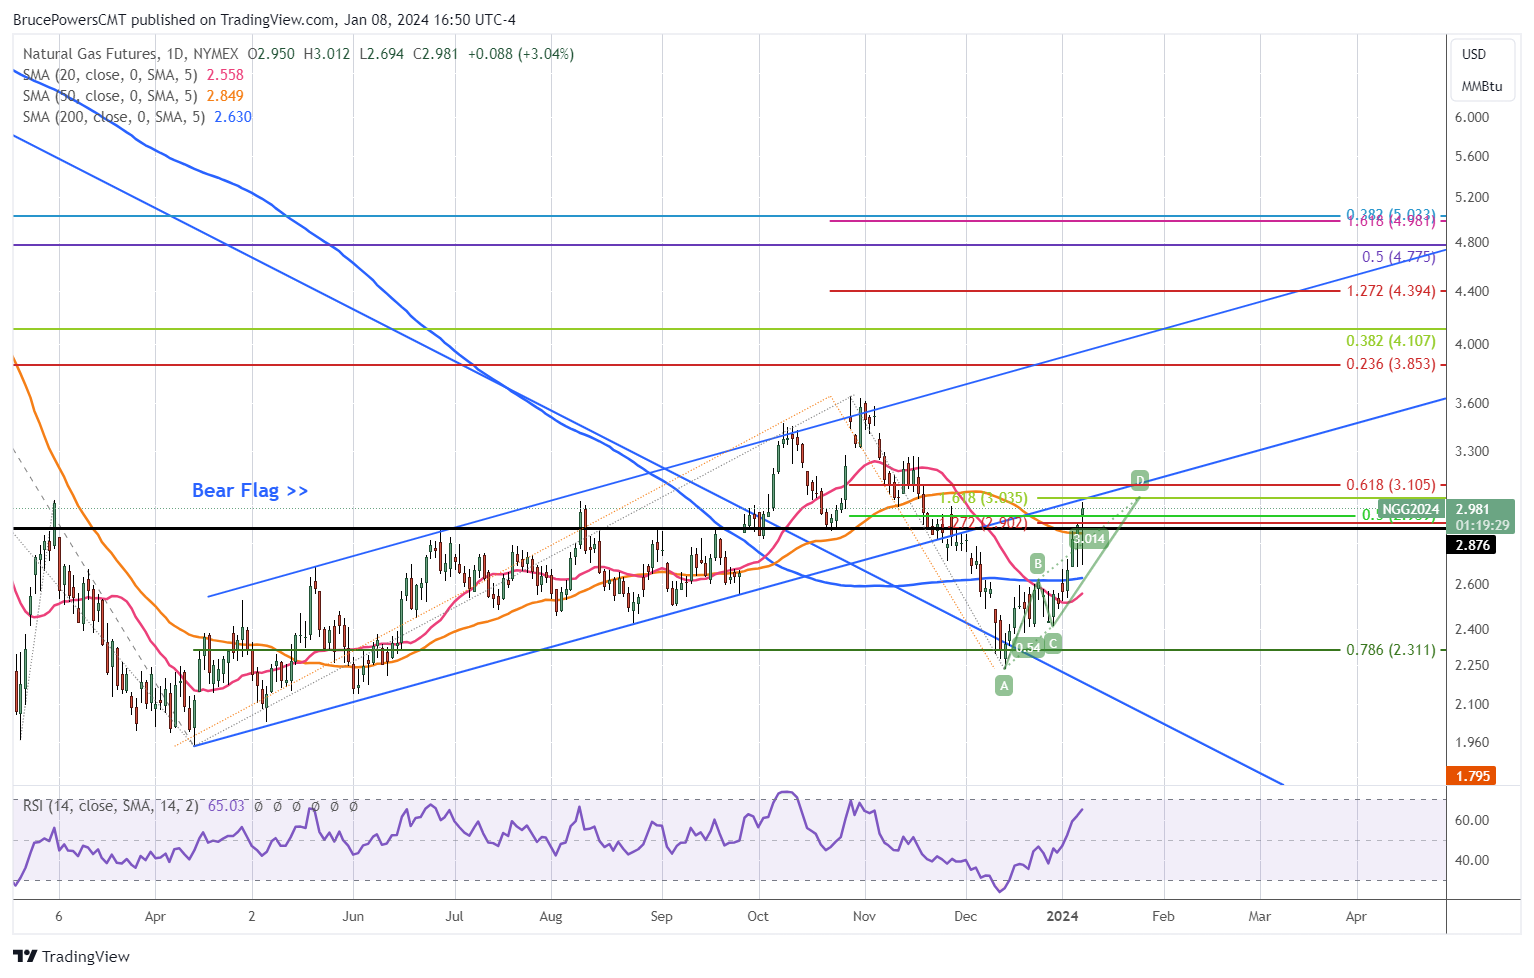
Natural gas triggers a bullish trend continuation signal on Monday as it trades above last week’s high of 2.91. Subsequently, selling set in, with the price of natural gas falling intraday to test support of the past couple of trading days. Buyers stepped up again near lows of the day to take natural gas back up above last week’s high again, which is where it remains at the time of this writing.
Such an intraday flush out and recovery rally bodes well for the bulls in the foreseeable future as the sellers were in control for a while, but they could not maintain control. Natural gas is now on track to close strong, in the top third of the day’s range and above last week’s high.
Confirm Strength with Surge Above 50% Retracement
The 50% retracement at 2.94 was exceeded today with a strong close above that level a real possibility. Moreover, Monday may end with a bullish doji hammer candlestick pattern. A breakout will be indicated on a move above today’s high of 2.97 (may change by close). Natural gas then heads towards 3.04, which is the 161.8% extended target for a rising ABCD pattern. The 161.8% Fibonacci ratio is used to extend the CD leg of the rally beyond the price distance seen in the first AB leg up. Further up is the 61.8% Fibonacci retracement level at 3.11.
Rally Reaches Average Performance Zone of Past Five Rallies
Since reversing off the recent bottom of 2.24 (A) natural gas has rallied as much as 0.74 or 33.2% as of today’s high. It has reached the target area that roughly matches the past five rallies since the trend bottom in April at 1.95. As it approaches the underside of the rising parallel trend channel to test resistance the chance of the rally completing increases.
Nevertheless, the current advancement has put natural gas back above the major moving averages. Yesterday, an advance above the 20-Day MA was confirmed with a daily close above it for the first time since November 16. Out of the prior five rallies examined, the largest advance was 0.92 or 36%. A match with the current rally occurs at approximately 3.15.
About the Author
Bruce Powersauthor
Bruce boasts over 20 years in financial markets, holding senior roles such as Head of Trading Strategy at Relentless 13 Capital and Corporate Advisor at Chronos Futures. A CMT® charter holder and MBA in Finance, he's a renowned analyst and media figure, appearing on 150+ TV business shows.
Did you find this article useful?
Latest news and analysis


Advertisement