
Advertisement
Advertisement
Reading the Signs: Natural Gas Bulls Eyeing a Reversal
By:
Natural gas exhibits signs of strength, breaking yesterday’s high, revealing a potential bullish reversal on the horizon.

In this article:
Natural Gas Forecast Video for 15.12.23 by Bruce Powers
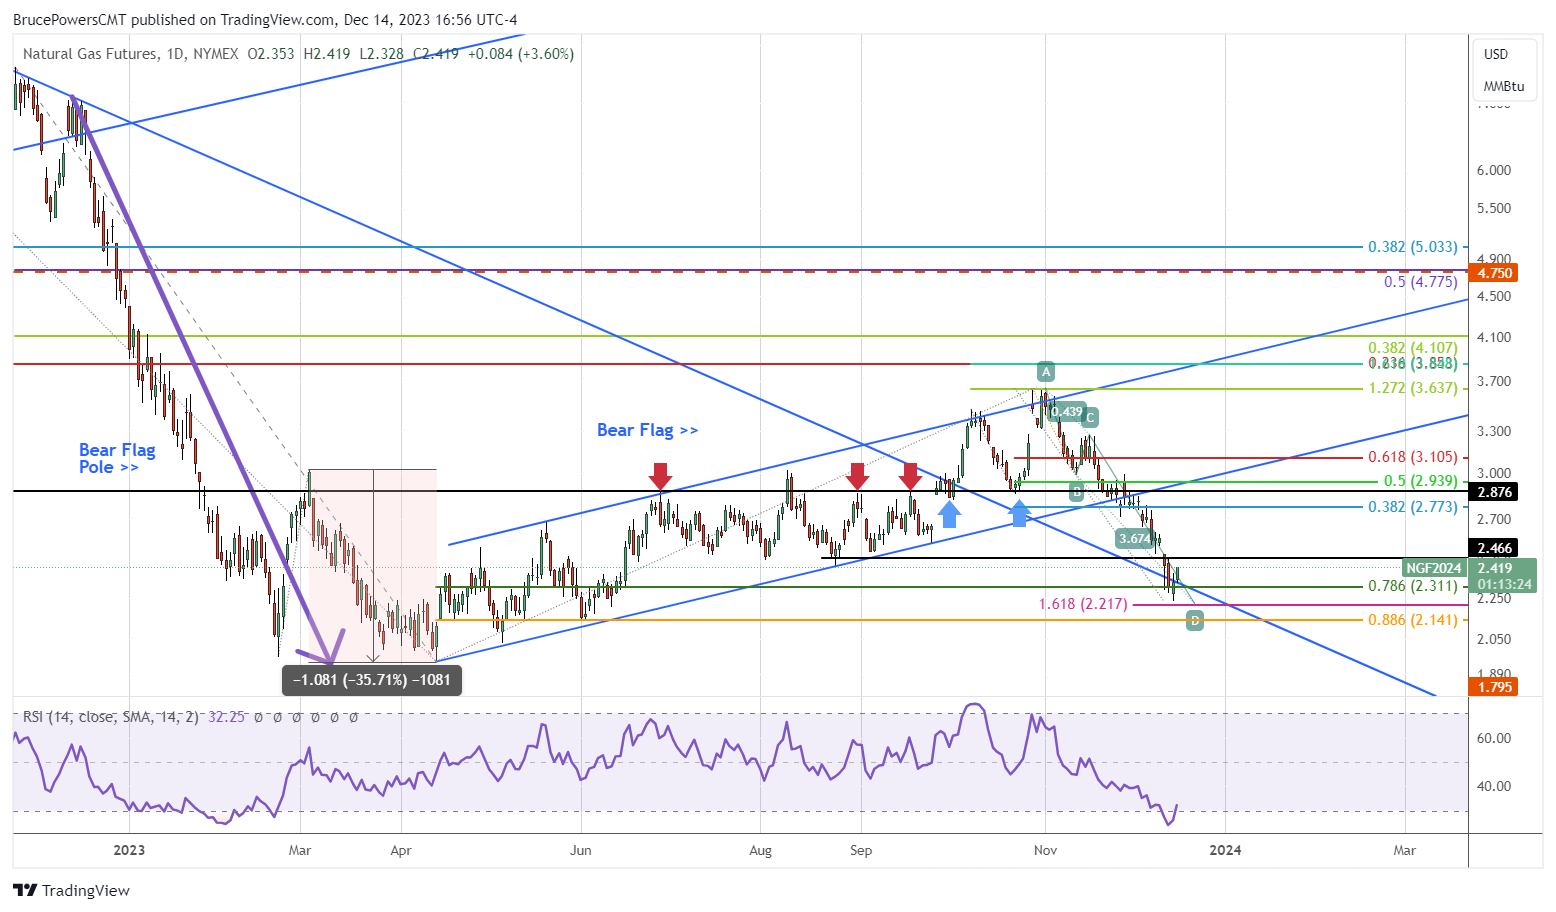
Today is the first time in seven trading days that the current day’s trading range exceeded the high of the prior day. This is a minor sign of strength within a downtrend as yesterday’s high of 2.385 was exceeded to the upside. An additional sign of strength will occur if today closes above yesterday’s high. Yesterday’s low of 2.235 may have completed the retracement.
Rise Above Prior Day’s High is a Start
Today’s bullish price action is the start of a possible continuation to the upside, but it is only a start. The relative strength index (RSI) has reached an extreme overbought condition and has turned up as of today. It was February of this year that the RSI was previously as low. Minor resistance sits around 2.425. Once a daily close completes above the three-day high of 2.46, it looks like natural gas will then have a chance of continuing to strengthen.
Correction has Been Healthy
Yesterday’s low completed a 38.7% decline in the price of natural gas thereby exceeding the prior extended correction that began from the March swing high. That high was followed by a 35.7% decline. All subsequent corrections were of less magnitude. Having such a relatively large correction might set the stage for an aggressive rally. The more the rubber band is stretched in one direction the greater the chance for a spike in the opposite direction once released. A similar dynamic occurs in financial markets.
Needs to Get Above Weekly High Key of 2.49
This week’s high is 2.49. That is the price that needs to be recaptured before natural gas has a real shot at advancing higher. It will then be rising to test prior support areas as resistance. Some of the key levels are represented by the rising lower trendline. Moreover, there is a critical horizontal price zone that has marked support or resistance a few times in prior months. It stands around 2.88.
It is interesting that the minimal 38.2% Fibonacci retracement sits up at 2.77. Once a rally kicks in that should be the minimum target price. Yesterday’s low has some significance if it holds in that an extended falling ABCD pattern completes just below at 2.22. Arguably, close enough. The target is a pivot level that will act as support or indicate a bearish continuation of price keeps falling. So far, it is acting as support making a rally the most likely scenario next for natural gas.
For a look at all of today’s economic events, check out our economic calendar.
About the Author
Bruce Powersauthor
Bruce boasts over 20 years in financial markets, holding senior roles such as Head of Trading Strategy at Relentless 13 Capital and Corporate Advisor at Chronos Futures. A CMT® charter holder and MBA in Finance, he's a renowned analyst and media figure, appearing on 150+ TV business shows.
Did you find this article useful?
Latest news and analysis


Advertisement