
Advertisement
Advertisement
Natural Gas Rally: Testing Limits, Eyeing a Breakout Surge
By:
Despite grappling with the 200-Day EMA, natural gas shows signs of an ongoing uptrend, marked by a higher swing low and a striking resemblance to a previous correction.

In this article:
Natural Gas Forecast Video for 16.11.23 by Bruce Powers
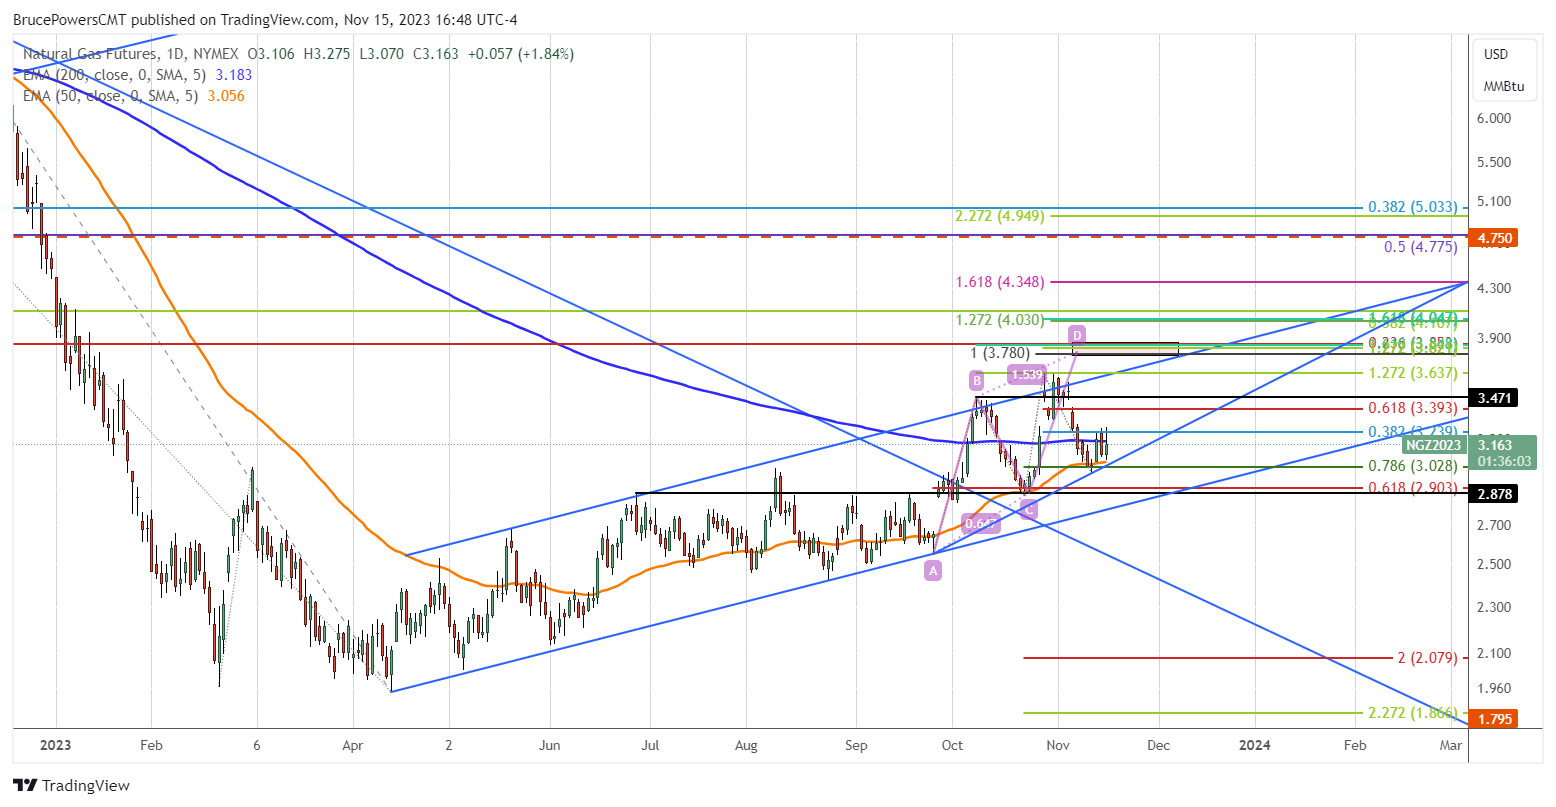
Today’s price action in natural gas once again tested support around the 50-Day EMA (orange) with the day’s low of 3.09. A rally followed taking it up to exceed yesterday’s high of 3.26 thereby triggering an outside day. Resistance continues to be seen around the 38.2% Fibonacci retracement. Today’s advance triggered a continuation of the rally with a new high for the developing uptrend at 3.275.
Support Holding Around 50-Day EMA
Support has been seen for the past three days around the 50-Day EMA (3.06) and it continues to hold. This is a bullish sign. At the same time natural gas has struggled to get back above the 200-Day EMA (blue). You can see how it has traded above the 200-Day line for each of the past several days but closed either around the line or below it. We need to see decisive breakout above the 200-Day EMA and daily closes above it to confirm strength.
Bullish Price Structure
Nevertheless, the recent price structure of the uptrend shows a likely continuation higher. Although further confirmation of strength is needed from the recent swing low of 2.99 three days ago provides a higher swing low. In addition, it successfully tested support of the 50-Day EMA for the second time since natural gas gapped above the line on September 27. However, further signs of strength are needed to make sure that retracement low is going to complete the short-term correction.
Similarity in Price and Time
Further evidence that the low may be in can be seen by looking at similarities in both price and time between the current correction and the prior correction. Following the peak at the October 9 swing high (B) natural gas declined by 17.6% in 10 days. Subsequently, assuming a bottom has been reached, the current correction completed a 17.95% decline on November 10 low, also in 10 days.
Since there is similarity in the corrections there might also be a relationship between the advance that follows the bottom. Following the October 23 bottom at 2.86 the price of natural gas advanced by 27.3% in only four days. It looks too late to have a match in time given how slow natural gas has been to continue to strengthen from the recent low. However, the current advance from the November 10 low will match the previous 27.3% rally at 3.80. That is within the target zone highlighted on the chart starting at 3.78.
For a look at all of today’s economic events, check out our economic calendar.
About the Author
Bruce Powersauthor
Bruce boasts over 20 years in financial markets, holding senior roles such as Head of Trading Strategy at Relentless 13 Capital and Corporate Advisor at Chronos Futures. A CMT® charter holder and MBA in Finance, he's a renowned analyst and media figure, appearing on 150+ TV business shows.
Did you find this article useful?
Latest news and analysis


Advertisement