
Advertisement
Advertisement
Charting the Course: Natural Gas Signals Uptrend Amid Market Shift
By:
Natural gas's bullish reversal sparks optimism, breaking above key levels and setting the stage for a continuation of the uptrend.
In this article:
Natural Gas Forecast Video for 15.11.23 by Bruce Powers
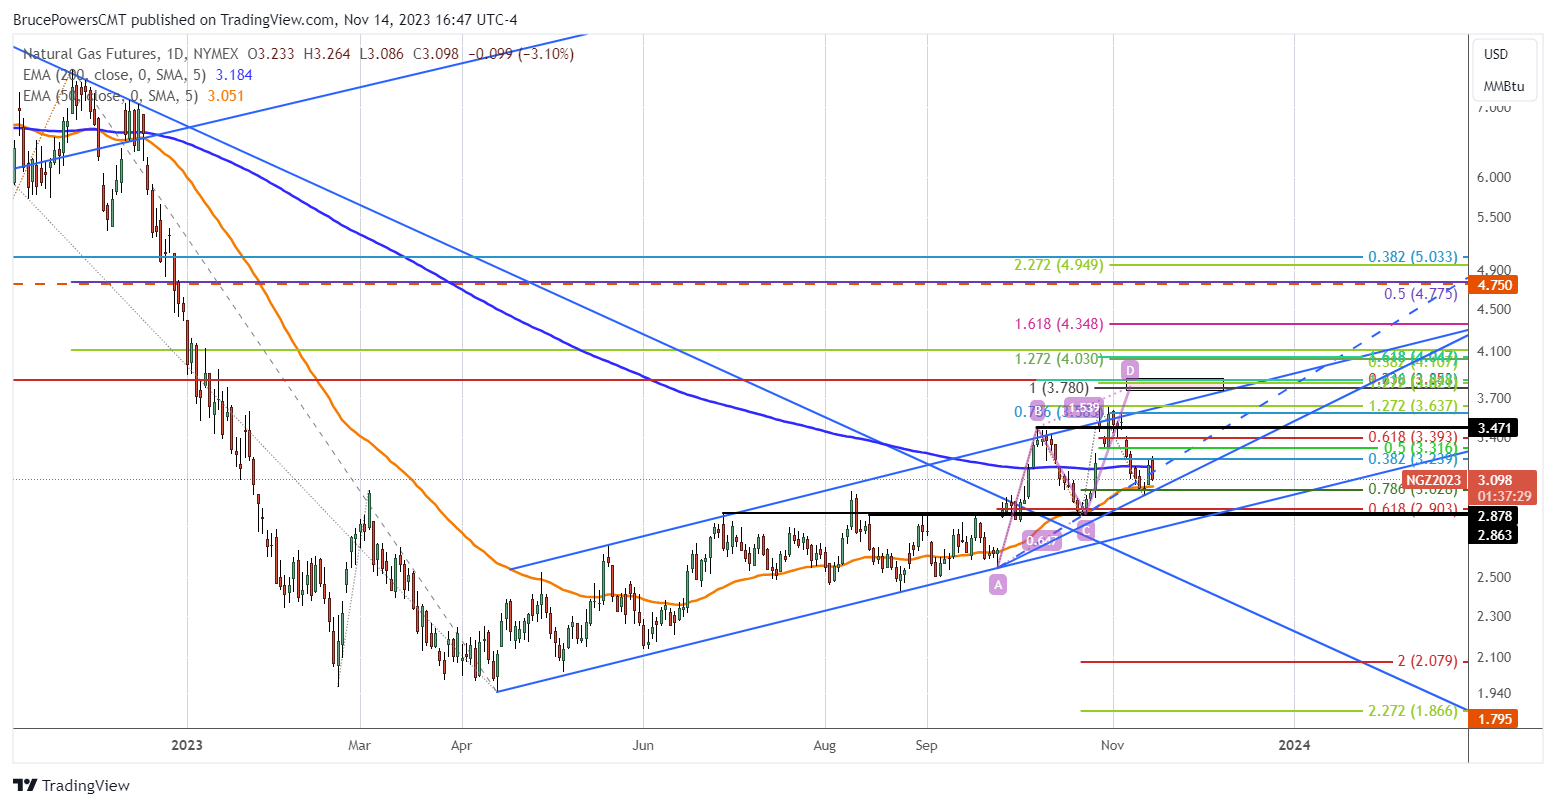
Following yesterday’s bullish reversal off the 2.99 swing low natural gas broke out above the 200-Day EMA and managed to close above it for Monday, but just barely. The advance completed a 38.2% retracement at 3.24. Subsequently, previous support near the 50-Day EMA was tested today as natural gas advanced slightly above yesterday’s highs before turning down and selling off. At the time of this writing, it continues to show weakness, trading near the lows of the day’s range. Nevertheless, natural gas remains on track to end with a second day of higher daily lows and higher daily highs, the beginning of an uptrend.
Holding Above the 50-Day EMA Targets Higher Prices
Unless there is a drop below the recent 2.99 swing low natural gas is anticipated to continue to advance. Yesterday’s breakout day showed strong momentum (wide range green candle closing in the top third of the day’s trading range (greater than 3.18). The selloff today’s tempers those bullish indications yet what happens next will provide insight.
Second Successful Test of the 50-Day EMA
Following the January 9 peak, which had natural gas above both the 50 and 200-Day EMAs, it retraced lower to successfully test the 50-Day EMA as support around the October 23 swing low. This is important, as prior to that natural gas had traded above and below the 50-Day since the April bottoming process.
The low two days ago was the second successful test of support and rejection of price to the upside. It reflects a change in trend as the overall advance from the April lows increases its rising slope. It may be easier to visualize this change when looking at the internal trendline versus the initial lower uptrend line. It reflects increasing upward momentum as the rate of change of price increases.
Next Price Targets
Note that the 61.8% Fibonacci retracement of the recent decline is at 3.39, just shy of opening of a down gap on November 6. The gap will fill at 3.45, very close to the October 9 swing high at 3.47. If natural gas is going to test the recent 3.64 swing high and possibly rise above it, it first needs to reclaim these lower price levels.
For a look at all of today’s economic events, check out our economic calendar.
About the Author
Bruce Powersauthor
Bruce boasts over 20 years in financial markets, holding senior roles such as Head of Trading Strategy at Relentless 13 Capital and Corporate Advisor at Chronos Futures. A CMT® charter holder and MBA in Finance, he's a renowned analyst and media figure, appearing on 150+ TV business shows.
Did you find this article useful?
Latest news and analysis


Advertisement